
Living Kidney Transplant: The Influence of Intra-Operative Hemodynamics on Delayed Graft Function
Abstract
Purpose
Intra-operative insults may subject living kidney transplants to poor outcomes. Therefore, we investigated whether intra-operative recipient and donor hemodynamics could act as predictors of delayed graft function and subsequent outcomes.
Materials and Methods
Living kidney donors and recipients from 2010-2016 at this institution underwent a retrospective chart review. Graft function by post-operative day 7 was used to classify recipients as delayed graft function (need for dialysis), slow graft function (creatinine > 2.5) and good function. Groups were analyzed for intra-operative hemodynamic differences and at one year, incidence of rejection, graft function and survival were compared.
Results
A total of 111 living renal transplants were performed. Average recipient age was 50 and just over halfwere male (53%). 9% (n=10) and 10% (n=11) developed delayed graft function and slow graft function, respectively. Minimum recipient post re-perfusion central venous pressure ≥12 mmHg was associated with poor graft function (delayed graft function/slow graft function/good function=67%/56%/24%, p=0.009), while intra-operative hypotension (systolic <90 mmHg or diastolic <50 mmHg) was not. Delayed graft function and slow graft function had higher incidences of rejection than good function (30% and 36% vs 9%, p=0.012). Graft function and survival were similar. One patient died with a functioning graft.
Conclusions
This single center retrospective study suggests that a post re-perfusion central venous pressure ≥12 mmHg is associated with delayed graft function.
Article Information
- Received
- Accepted
- Published
Academic Editor: Sageshima Junichiro, University of California Davis Medical Center, House staff Building #2011,2315 Stockton Boulevard, Email: [email protected]
Checked for plagiarism: Yes
Review by: Single-blind
Copyright © 2017 Ryan J. Schutt, et al.
 This is an open-access article distributed under the terms of the Creative Commons Attribution License, which permits unrestricted use, distribution, and reproduction in any medium, provided the original author and source are credited.
Corresponding author: Ryan J. Schutt, D.O. (general surgery resident), 1-361-960-9055, 10666 North,, Torrey Pines Road, La Jolla, CA 92037 —
Competing Interests
The authors have declared that no competing interests exist.
Funding
No specific funding statement was provided by the authors.
Data Availability
No data-availability statement was provided by the authors.
Acknowledgements
We gratefully acknowledge the Fred and Betty Farago Research Fund for providing partial funding of this work.
Citation:
Introduction
Living donors are the preferred source of kidneys for transplant as they offer better quality of life, graft- and patient survival 1, 2. Despite these superior results, allografts from living donors may still be subject to peri-operative insults, which may lead to both poor short and long-term outcomes. Delayed graft function (DGF) is a well-known entity with many definitions, but a common end state: poor initial graft function with subsequent higher rates of acute rejection, graft loss, patient death and chronic allograft nephropathy (CAN) 3, 4, 5. DGF may occur in the allograft from a living donor, although its incidence is lower than in deceased donor transplants 6, 7, 8. The pathophysiology of DGF remains unclear, and probably has an admixture of elements of ischemia-reperfusion injury and the host immune response leading to acute kidney injury 9. Risk factors for DGF can stem from both donor and recipient characteristics, as well as immunologic risks 9, 10. Intra-operative hemodynamic variables are not as well studied. Prior research has focused on central venous pressure (CVP) and arterial blood pressure mostly in the recipient of a deceased donor renal transplant. There are varying opinions on optimal CVP during renal transplant. Most have recommended a CVP in the higher range of 10-15 mmHg 11, 12, 13. However, other studies have shown either a lack of effect or a lower CVP to be acceptable 14, 15, 16, 17. Additionally, systolic blood pressure (SBP) should probably be maintained above 120 mmHg, while mean arterial pressures (MAP) should be above 90 mmHg 16, 18, 19. We were specifically interested in investigating the influence of donor and recipient intra-operative hemodynamic variables in a living kidney transplant on the incidence of DGF.
Methods
Data collection and analysis for this single center retrospective study was approved by the Scripps Health Institutional Review Board. Subjects included all recipients of a living donor transplant and their respective donors from February 2010 - July 2016. The only inclusion criteria were a living kidney transplant, and age >18 years. Living donors and recipients underwent an extensive pre-operative workup by the transplant team to determine eligibility prior to proceeding with donation and transplantation. The majority of recipients received a cardiac evaluation and clearance in some manner. A significant proportion of recipients received a chemical or exercise stress test in lieu of a 2D echocardiogram. Thus, comparing resting mean pulmonary artery pressures amongst groups was not able to be performed. Donors receive a pre-operative CT scan to identify any vascular or ureteral anatomy that would preclude a technically sound reconstruction or transplantation and if identified are not considered for donation. Donors underwent a laparoscopic hand-assisted left donor nephrectomy and rarely a right nephrectomy by a single surgeon with a standard intra-peritoneal pressure of 12 mmHg. All ureteral anastomoses were performed over a stent.
Recipients underwent internal jugular triple lumen central line placement prior to the start of surgery. Anti-thymocyte globulin (ATG) 2 mg/kg intravenous piggy back over 12 hours was started in the operating room. Tacrolimus was started once the serum creatinine fell by 50% or under 3 mg/dl, or by postoperative day 7 in cases of DGF.
Data was retrospectively collected from the electronic medical record system and de-identified for the United Network for Organ Sharing Research Department. Recipient and donor demographic and pre-operative variables were collected. Total intra-operative fluid volumes were also recorded for the recipient and donor. Hemodynamic variables collected in the donor (pre-vascular clamping) and recipient (post-perfusion) included minimum SBP and diastolic blood pressures (DPB), and in the recipient only, post-perfusion CVP. Central venous pressure < or ≥ 12 mmHg was used as a cut off. An SBP < 90 mmHg or DPB < 50 mmHg was considered a hypotensive event. One year outcomes included rejection within the first year post-transplant, evidence of CAN on 1-year protocol biopsies, graft loss (return to dialysis or death), and graft function as measured by creatinine at 1 year.
Recipient post-operative allograft function was divided into three cohorts based on the first 7 days after transplant. DGF was defined as the need for dialysis in the first 7 days post-operatively, slow graft function (SGF) was defined as a creatinine > 2.5 mg/dl on post-operative day 7 and good function (GF) was defined as no need for dialysis and a creatinine ≤ 2.5 mg/dl by post-operative day 7 8, 20. Univariate analyses evaluated differences between graft function groups and were performed in R using Hmisc package.Categorical variables were reported by frequency and compared using a Pearson Chi-square test for association. Continuous variables were reported using the mean and interquartile ranges and compared using a Kruskal-Wallis test.
Results
A total of 111 living donors and recipients were evaluated, with recipient demographic data presented in Table 1. Ninety (81%) patients had GF, while 11 (10%) had SGF and 10 (9%) had DGF. The average age of recipients was 50 years old and differed significantly by graft function, with the oldest recipients experiencing DGF more frequently (p=0.027). Males experienced poor graft function more often than females (p=0.018). Statistical differences were also found in height (p=0.008), weight (p=0.008), BMI (p=0.019), and body surface area (p=0.004) by graft function, showing recipients with poor graft function (DGF or SGF) having the larger body measurements. Despite these body metrics there were no significant differences when comparing donor to recipient size ratios that would indicate size mismatch (Table 2).The three most common causes of renal failure were polycystic kidney disease (n=21), diabetes (n=18) and glomerulonephritis / glomerulosclerosis (n=25), accounting for 57.6% of primary diagnoses. Seven patients had an unknown cause of renal failure. There were no observed differences in primary diagnosis by graft function. Of the 10 recipients of previous transplants, none had worse graft function compared to the first time transplant recipients. Most recipients (73%) were dialysis dependent prior to transplant, with no difference in the numbers undergoing peritoneal dialysis (n=41) vs. hemodialysis (n=40). Dialysis dependence (peritoneal and hemodialysis combined) was not associated with DGF, however, patients dependent on hemodialysis experienced higher rates of DGF (90%) compared to those with GF or SGF (31% and 27%, p<0.001). Pre-operative creatinine levels were comparable among the three groups, as was recipient blood type, presence of pre-formed donor specific antibodies,presence of HLA mismatch and PRA status.
Table 1. Recipient Demographics| n | DGF (n=10) | SGF (n=11) | GF (n=90) | p-value | |
| Age (years) | 11 1 | 48.365.5 72.0 | 43.051.0 67.0 | 38.348.5 60.0 | 0.027 |
| Sex | 11 1 | 0.018 | |||
| Male | 80% (8) | 82% (9) | 47% (42) | ||
| Female | 20% (2) | 18% (2) | 53% (48) | ||
| Height (cm) | 11 1 | 163.5 170.0 178.7 | 177.0182.0 185.5 | 160.3168.0 178.0 | 0.008 |
| Weight (kg) | 11 1 | 68.2 84.2 94.6 | 76.4103.5 114.5 | 58.775.5 86.9 | 0.008 |
| BMI (kg/m2) | 10 9 | 26.530.4 30.9 | 27.2 30.3 32.6 | 22.326.5 29.8 | 0.019 |
| BSA (m2) | 10 9 | 1.72.02.2 | 1.9 2.3 2.4 | 1.71.9 2.1 | 0.004 |
| Pre-Operative Creatinine (mg/dl) | 11 1 | 6.17.2 8.5 | 6.37.3 11.7 | 5.16.7 9.2 | 0.575 |
| Primary Diagnosis | 11 1 | 0.377 | |||
| Diabetes | 30% (3) | 9% (1) | 16% (14) | ||
| Hypertension | 30% (3) | 9% (1) | 8% (7) | ||
| Polycystic Kidney Disease | 10% (1) | 36% (4) | 18% (16) | ||
| Re-Transplant | 0% (0) | 9% (1) | 4% (4) | ||
| Autoimmune | 10% (1) | 0% (0) | 16% (14) | ||
| Glomerular Disease | 20% (2) | 18% (2) | 23% (21) | ||
| Other/Unknown | 0% (0) | 18% (2) | 16% (14) | ||
| Previous Transplant | 11 1 | 0% (0) | 18% (2) | 9% (8) | 0.346 |
| Pre-Transplant Dialysis | 11 1 | 100% (10) | 73% (8) | 70% (63) | 0.128 |
| Hemodialysis | 11 1 | 90% (9) | 27% (3) | 31% (28) | <0.001 |
| Peritoneal Dialysis | 11 1 | 10% (1) | 45% (5) | 39% (35) | 0.165 |
| Blood Type | 11 1 | 0.205 | |||
| A | 40% (4) | 18% (2) | 43% (39) | ||
| AB | 0% (0) | 9% (1) | 1% (1) | ||
| B | 20% (2) | 9% (1) | 22% (20) | ||
| O | 40% (4) | 64% (7) | 33% (30) | ||
| PRA Class I Sensitized (>20%) | 105 | 0% (0) | 22% (2) | 6% (5) | 0.116 |
| PRA Class II Sensitized (>20%) | 105 | 20% (2) | 11% (1) | 6% (5) | 0.255 |
| Pre-formed Donor Specific Antibody | 104 | 0% (0) | 18% (2) | 5% (4) | 0.21 |
| Any HLA Mismatch | 110 | 67% (6) | 91% (10) | 87% (78) | 0.232 |
Notably, minimum CVP ≥12 mmHg was associated with poor graft function (DGF/SGF/GF= 67%/56%/24%, p=0.009) (Table 2). However, an incident of intra-operative hypotension was not statistically associated with graft function. There were no statistical differences in cold ischemic time, warm ischemic time, estimated blood loss or intra-operative fluid volumes received. Additionally, the use of furosemide, mannitol and albumin did not influence graft function.
Table 2. Donor-Recipient Size Ratios| n | DGF (n=10) | SGF (n=11) | GF (n=90) | p-value | |
| Donor-Recipient Height Ratio (cm) | 99 | 1.00 1.04 1.06 | 0.96 0.97 0.97 | 0.92 0.98 1.04 | 0.11 |
| Donor-Recipient Weight Ratio (kg) | 110 | 0.90 1.01 1.12 | 0.74 0.80 1.04 | 0.81 1.00 1.28 | 0.18 |
| Donor-Recipient BSA Ratio (kg/m2) | 96 | 0.99 1.03 1.11 | 0.84 0.87 0.96 | 0.86 1.00 1.12 | 0.09 |
| Donor-Recipient BMI Ratio (m2) | 97 | 0.91 0.99 1.09 | 0.82 0.85 0.96 | 0.90 1.02 1.23 | 0.18 |
The average donor age was 44, and groups were similar in age based on graft function (Table 3).Fifty eight donors (52.7%) were female, while 52 (47.3%) were male.
Donor sex did not appear to influence recipient graft function, nor did gender mismatch. Most donors (n=62) were unrelated and the donor’s relationship to the recipient was not associated with graft function. Donors with grafts resulting in poor function were taller (p=0.03) and weighed more (p=0.02). However, donor BMI and body surface area were not related to graft function. Pre-operative creatinine of the donor had no bearing on graft function, nor did the presence of donor hypertension or blood type. There was no statistical association between donor estimated blood loss, total intra-operative fluid volume received, administration of albumin or furosemide. No association was found between donor intra-operative hypotension and graft function (Table 2).
Table 3. Recipient and Donor Intra-Operative Variables Explored As Risk Factors for DGF| n | DGF (n=10) | SGF (n=11) | GF (n=90) | p-value | |
| Recipient | |||||
| Cold Ischemic Time (min) | 111 | 43.0 47.0 57.0 | 42.5 49.0 295.5 | 40.0 44.5 51.7 | 0.339 |
| Warm Ischemic Time (min) | 110 | 28.3 30.0 32.8 | 27.5 31.0 37.0 | 27.0 30.0 34.0 | 0.699 |
| Estimated Blood Loss (ml) | 93 | 37.5 100.0 100.0 | 50.0 100.0 100.0 | 50.0 50.0 100.0 | 0.901 |
| Fluids (ml) | 105 | 2000 2250 2700 | 2350 2800 3300 | 2275 3000 3325 | 0.124 |
| Albumin Use | 107 | 70% (7) | 55% (6) | 64% (55) | 0.752 |
| Mannitol Use | 106 | 70% (7) | 91% (10) | 75% (64) | 0.456 |
| Lasix Use | 107 | 100% (10) | 100% (11) | 92% (79) | 0.401 |
| Intra-Operative Hypotension | 106 | 60% (6) | 45% (5) | 44% (37) | 0.613 |
| Minimum Intra-Operative CVP | 85 | 0.009 | |||
| < 12 mmHg | 33% (3) | 44% (4) | 76% (51) | ||
| ≥ 12mmHg | 67% (6) | 56% (5) | 24% (16) | ||
| Donor | |||||
| Estimated Blood Loss (ml) | 68 | 35.0 50.0 50.0 | 27.5 50.0 50.0 | 20.0 50.0 50.0 | 0.605 |
| Fluids (ml) | 99 | 2000 2750 3000 | 2250 2750 3350 | 2300 2800 3200 | 0.779 |
| Albumin Use | 99 | 0% (0) | 0% (0) | 4% (3) | 0.742 |
| Lasix Use | 101 | 88% (7) | 100% (8) | 74% (63) | 0.191 |
| Intra-Operative Hypotension | 106 | 60% (6) | 45% (5) | 44% (37) | 0.613 |
Regarding 1 year recipient outcomes (Table 4, Table 5, Table 6 and Figure 1), 70%, 82% and 83% of DGF, SGF and GF patients respectively, had 1 year worth of follow up. Nine percent of GF patients experienced rejection, while 30% of DGF and 36% of SGF patients had rejection (p=0.012). Moreover, type of rejection differed by graft function with only DGF patients experiencing acute antibody mediated rejection (n=3), while acute cellular rejection was more common in the GF cohort (n=8, p=0.006). One year interstitial fibrosis, tubular atrophy, Chronic Allograft Damage Index and Banff chronic allograft nephropathy scores on 1-year protocol biopsieswere similar. There was one graft loss within 1 year secondary to death (GF cohort), but this patient died with a functioning graft. Kidney function at 1 year based on creatinine levels was comparable.
Table 4. Donor Demographics| n | DGF (n=10) | SGF (n=11) | GF (n=90) | p-value | |
| Age (years) | 111 | 43.347.5 52.3 | 39.546.0 56.5 | 37.045.0 52.0 | 0.434 |
| Sex | 110 | 0.584 | |||
| Male | 60% (6) | 55% (6) | 45% (40) | ||
| Female | 40% (4) | 45% (5) | 55% (49) | ||
| Height (cm) | 99 | 164.3174.0 181.0 | 174.5177.5 180.1 | 157.8167.0 170.5 | 0.031 |
| Weight (kg) | 110 | 80.985.7 91.1 | 78.385.2 93.4 | 65.274.7 85.5 | 0.022 |
| BMI (kg/m2) | 99 | 26.827.2 29.2 | 24.725.9 27.9 | 24.027.1 28.8 | 0.644 |
| BSA (m2) | 98 | 1.92.0 2.1 | 1.92.0 2.0 | 1.71.8 2.0 | 0.147 |
| Pre-Operative Creatinine (mg/dl) | 108 | 0.80.8 0.9 | 0.80.9 1.0 | 0.70.8 1.0 | 0.481 |
| History of Hypertension | 67 | 20% (1) | 50% (2) | 16% (9) | 0.218 |
| Relationship to Recipient | 111 | 0.498 | |||
| First Degree Relative | 30% (3) | 18% (2) | 37% (33) | ||
| Other Blood Relative | 0% (0) | 18% (2) | 10% (9) | ||
| Unrelated | 70% (7) | 64% (7) | 53% (48) | ||
| Blood Type | 109 | 0.914 | |||
| A | 33% (3) | 27% (3) | 29% (26) | ||
| AB | 0% (0) | 0% (0) | 1% (1) | ||
| B | 11% (1) | 0% (0) | 12% (11) | ||
| O | 56% (5) | 73% (8) | 57% (51) |
| n | DGF (n=10) | SGF (n=11) | GF (n=90) | p-value | |
| Rejection | 111 | 30% (3) | 36% (4) | 9% (8) | 0.012 |
| Rejection Type | 15 | 0.006 | |||
| Acute Antibody Mediated Rejection | 100% (3) | 25% (1) | 0% (0) | ||
| Acute Cellular Rejection | 0% (0) | 75% (3) | 100% (8) |
| n | DGF | SGF | GF | p-value | |
| Graft Survival | 91 | 100% (7) | 100% (9) | 98.6% (74) | 0.331 |
Figure 1. One Year Kidney Function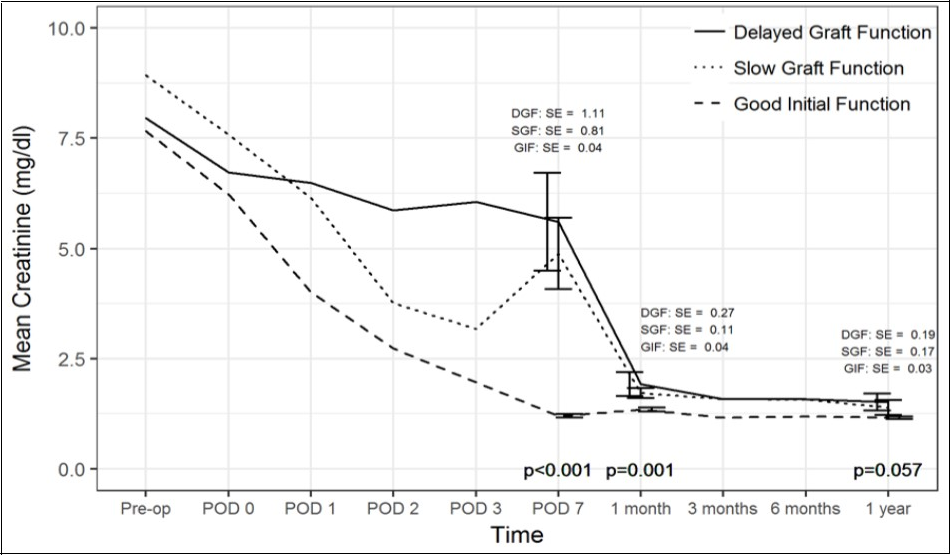
Download figure
Comparison of creatinine trend over time between the three cohorts. SE(standard error).
Discussion
This single center retrospective analysis of 111 living kidney transplants investigated the influence of recipient and donor intra-operative hemodynamics on first week post-transplant graft function. To our knowledge this is the first study to look at both recipient and donor intra-operative variables and their impact on DGF. The incidence of DGF in our study was comparable to rates reported in the literature for living kidney transplants, being at approximately 4-16% 1, 21. This is lower than the reported 20-40% rate of DGF from deceased donor kidneys 7, 22, 23. We included a third cohort in our study, SGF, as a means to identify patients that did not adhere to the classic definition of DGF, but also did not have ideal graft function. SGF is a known entity in the literature with variable definitions, but the unifying definition was that they did not have optimal graft function or outcomes 20, 22. We defined SGF as a serum creatinine >2.5 mg/dl on post-op day 7 to align this with the definition of need for dialysis within 7 days for DGF 8, 20.
Contrary to previous work in this field we determined a lower post-perfusion central venous pressure appears to be favorable to reduce the incidence of DGF. This may suggest a contributory role from venous hypertension resulting in renal congestion with resultant reduced glomerular filtration rate, local hypoxia and a pro-inflammatory state 24. Othman et al. 13randomized 40 living renal transplants to either a normal saline constant infusion rate of 12 ml/kg/hr, or a target central venous pressure (CVPT) of 15 mmHg. Ischemic times were similar, but CVPs were significantly different. They noted an earlier onset of urine production in the CVPT group (77±35 s) vs. the constant infusion rate group (241±66 s, p<0.001), and a greater volume of urine production in the CVPT group (1540±339 ml vs 852±170 ml, p<0.001) and concluded that a target CVP of 15 mmHg ensures early graft function. Additionally, Carlier et al. 25 retrospectively reviewed 120 comparable cadaveric renal transplants by stratifying recipients into high and low pulmonary artery (>20 mmHg vs ≤20 mmHg) and diastolic pulmonary artery (>15 mmHg vs ≤15 mmHg) pressure groups. The high and low pulmonary artery pressure groups, at clamp release correlated with high and low mean CVPs of 14.2 mmHg and 12 mmHg respectively. The incidence of acute tubular necrosis was 6% versus 36% in the high and low pressure groups respectively. From this one could conclude that a CVP close to 14 mmHg is ideal. However, in agreement with our findings, there are multiple papers available that are not consistent with these recommendations and suggest that CVP either has little effect on outcomes, or that a lower pressure is favorable. For example, Aulakh et al. 17performed a retrospective review of 100 living renal transplants divided into two groups based on CVP <12 mmHg or >12 mmHg, and compared the trends in creatinine over 5 days. They ultimately noted no difference in the rate of creatinine downtrend. Another study noted that on multivariate analysis, higher CVP at patient awakening had the strongest association with immediate graft function, however, the mean CVP correlating with immediate graft function was only 9.71 mmHg 14. De Gasperi et al. 15 looked at the correlation between CVP and intra-operative fluid volumes and long term outcomes. They found that a CVP of 7-9 mmHg, and fluid volumes of 2400±1000 ml resulted in good functional recovery in 94% of patients, and the six month graft survival rate was 97.7%, with donor age being the only predictor of graft failure. We acknowledge that from the literature it is clear that there are various recommendations for CVP. In addition, the CVP may be influenced by the interplay of multiple complex factors to include baseline cardiac function, pre-operative volume status, proximity of surgery to last dialysis session, response to anesthesia and the anesthesiologists approach to managing intra-operative hemodynamics with fluids and vasopressor medications. Our study suggests a CVP below 12mmHg may reduce DGF.
While we found no association with DGF and intra-operative blood pressure, it should also be recognized that there is no consensus definition for intra-operative hypotension 26, which, if can be defined may lead to more accurate interpretations and results of such studies. Multiple studies have attempted to look for a relationship between DGF and intra-operative hypotension. For example, Sandid et al. 27 compared mean intra-operative SBP and DPB between immediate and SGF cohorts. Average blood pressures between the groups were 103/52 mmHg and 94/45 mmHg for immediate and SGF respectively. On multivariate logistic regression analysis, it was determined that intra-operative hypotension was an independent risk factor for SGF. Furthermore, Snoejis et al. 19 showed that an average intra-operative SBP below 110 mmHg increased the odds of primary non-function by 2.6. Perhaps, a validated definition of intra-operative hypotension would have allowed us to more accurately detect differences in graft function.
Our findings that fluid volume, use of Lasix, albumin or mannitol has no effect are consistent with the multiple differing results observed in the literature. There is general agreement that preventing intra-vascular depletion is pertinent. However, there is no agreed upon volume, as many factors come into play such as, but not limited to, length of case, recipient body mass, cardiovascular co-morbidities, type of fluid, and fluid adjuncts. Additionally, volume is often described in terms of CVP, which is not always an accurate surrogate for volume status. It is interesting to note that, although not statistically significant, the poor function groups received the lowest amount of intra-operative fluid despite having the higher CVP measurements. In our retrospective study the cause for this is difficult to qualify as multiple factors such as cardiac function, pre-operative volume overload and anesthesia approach may be at play. Perhaps the observation that slightly more patients in the DGF group received albumin and thus had less third spacing may have had an impact.
In our study 13.5% of patients experienced acute rejection, and there was a statistical association with poor function, which is consistent with a previously published meta-analysis 3. Despite multiple papers reporting DGF as a risk factor for graft loss, patient death and poor long-term function 3, 4, 8, in our current study, we found no such association. Additionally, we found no evidence on 1 year protocol biopsies of chronic allograft nephropathy, which is consistent with our findings of equivalent 1 year renal function based on creatinine levels. This is despite an association between DGF and chronic allograft nephropathy 5. In our study, the lack of association with these outcomes is probably related to the lower incidence of DGF than reported in the literature and follow up of only 1 year, which may have under-powered our study to detect these associations. However, even with the lower incidence we were able to find a significant correlation between both DGF and SGF and episodes of acute rejection when compared to the patients with good renal function.
Our study has certain limitations. First, this was a single center retrospective analysis, and perhaps not representative of the more inclusive experience among transplant centers in the US. Second, there is no protocol in place at our institution for frequency and timing of hemodynamic evaluation, thus standardized measuring of parameters were not available. Third, we had very few cases of DGF, which potentially hindered our ability to detect all risk factors and their strength of association. Also, we did not have baseline resting pulmonary artery and right heart pressures on all patients, nor could we control for the anesthesiologist’s approach to hemodynamic management during the case.Lastly, we only looked at outcomes at the 1 year time point which may not truly reflect the long term adverse effects of DGF.
Conclusion
A living kidney transplant is an excellent option for patients with end stage renal disease. Yet recipients of living donor kidneys are still at risk of delayed graft function. Knowledge of baseline cardiac pressures and pre-operative volume status may be of added benefit. Further attention by the surgeon and anesthesiologist to intra-operative hemodynamics during transplantation may help reduce delayed graft function. Specifically, consideration should be given to avoiding an overly aggressive central venous pressure, perhaps with the aid of other invasive means of hemodynamic monitoring such as pulmonary artery catheters or trans-esophageal echo. This recommendation is supported both by our data and other studies in the literature. More importantly, the lack of consensus in defining optimal intra-operative hemodynamics begs the need for larger prospective randomized trials.
Supplementary data
References
- 1.Kim W R, Lake J R, Smith J M, Skeans M A, Schladt D. (2016) . , Optn/Srtr2014Annual Data Report. Am J Transplant 16(2), 69-98.
- 2.Mange K C, Joffe M M, Feldman H I.(Mar8,2001) Effect of the use or nonuse of long-term dialysis on the subsequent survival of renal transplants from living donors. , N Engl J Med 344(10), 726-31.
- 3.Yarlagadda S G, Coca S G, Formica R N, Poggio E D, Parikh C R. (2009) Association between delayed graft function and allograft and patient survival: A systematic review and meta-analysis. , Nephrol Dial Transplant 24(3), 1039-47.
- 4.Tapiawala S N, Tinckam K J, Cardella C J, Schiff J, Cattran D C. (2010) Delayed graft function and the risk for death with a functioning graft. , J Am Soc Nephrol 21(1), 153-61.
- 5.Khalkhali H R, Ghafari A, Hajizadeh E, Kazemnejad A. (2010) Risk factors of long-term graft loss in renal transplant recipients with chronic allograft dysfunction. Exp Clin Transpl. 8(4), 277-82.
- 6.Nath J, Hodson J, Canbilen S W, Inston N G, Sharif A. (2016) Effect of cold ischaemia time on outcome after living donor renal transplantation. , Br J Surg 103(9), 1230-6.
- 7.Sharif A, Borrows R. (2013) Delayed graft function after kidney transplantation: The clinical perspective. , Am J Kidney Dis 62(1), 150-8.
- 8.Zeraati A A, Naghibi M, Kianoosh S, Ashraf H. (2009) Impact of Slow and Delayed Graft Function on Kidney Graft Survival Between Various Subgroups Among Renal Transplant Patients. Transplant. Proc 41(7), 2777-80.
- 9.Siedlecki A, Irish W, Brennan D C. (2011) Delayed graft function in the kidney transplant. , J Transplant 11(11), 2279-96.
- 10.Irish W D, Ilsley J N, Schnitzler M A, Feng S, Brennan D C. (2010) A risk prediction model for delayed graft function in the current era of deceased donor renal transplantation. , Am J Transplant 10(10), 2279-86.
- 12.Ferris R L, Kittur D S, Wilasrusmee C, Shah G, Krause E. (2003) Early hemodynamic changes after renal transplantation: determinants of low central venous pressure in the recipients and correlation with acute renal dysfunction. , Med Sci Monit 9(2), 61-66.
- 13.Othman M M, Ismael A Z, Hammouda G E. (2010) The impact of timing of maximal crystalloid hydration on early graft function during kidney transplantation. , Anesth Analg 110(5), 1440-6.
- 14.Bacchi G, Buscaroli A, Fusari M, Neri L, Cappuccilli M L. (2010) The influence of intraoperative central venous pressure on delayed graft function in renal transplantation: A single-center experience. Transplant. Proc 42(9), 3387-91.
- 15.A De Gasperi, Narcisi S, Mazza E, Bettinelli L, Pavani M. (2006) Perioperative Fluid Management in Kidney Transplantation: Is Volume Overload Still Mandatory for Graft Function? Transplant. Proc 38(3), 807-9.
- 16.Campos L, Parada B, Furriel F, Castelo D, Moreira P. (2012) Do intraoperative hemodynamic factors of the recipient influence renal graft function? Transplant. Proc 44(6), 1800-3.
- 17.Aulakh N K, Garg K, Bose A, Aulakh B S, Chanal H S. (2015) Influence of hemodynamics and intra-operative hydration on biochemical outcome of renal transplant recipients. , J Anaesthesiol Clin Pharmacol 31(2), 174-9.
- 18.Tiggeler R G, Berden J H, Hoitsma A J, Koene R A. (1985) Prevention of acute tubular necrosis in cadaveric kidney transplantation by the combined use of mannitol and moderate hydration. Ann Surg. 201(2), 246-51.
- 19.MGJ Snoeijs, Wiermans B, Christiaans M H, van Hooff JP, Timmerman B E. (2007) Recipient hemodynamics during non-heart-beating donor kidney transplantation are major predictors of primary nonfunction. , Am J Transplant 7(5), 1158-66.
- 20.Hall I E, Reese P P, Doshi M D, Weng F L, Schroppel B. (2016) Delayed graft function phenotypes and 12-month kidney transplant outcomes. , Transplantation 1, p..
- 21.Salamzadeh J, Sahraee Z, Nafar M, Parvin M. (2012) Delayed graft function (DGF) after living donor kidney transplantation A study of possible explanatory factors. , Ann Transpl 17(3), 69-76.
- 22.Humar A, Johnson E M, Payne W D, Wrenshall L, Sutherland D E. (1997) Effect of initial slow graft function on renal allograft rejection and survival. , Clin Transplant 11(6), 623-7.
- 23.Hetzel G R, Klein B, Brause M, Westhoff A, Willers R. (2002) Risk factors for delayed graft function after renal transplantation and their significance for long-term clinical outcome. , Transpl Int 15(1), 10-6.
- 24.Ross E A. (2012) Congestive renal failure: The pathophysiology and treatment of renal venous hypertension. , J Card Fail 18(12), 930-8.
- 25.Carlier M, Squifflet J P, Pirson Y, Gribomont B, Alexandre G P. (1982) Maximal hydration during anesthesia increases pulmonary arterial pressures and improves early function of human renal transplants. , Transplantation 34(4), 201-4.
Cited by (2)
This article has been cited by 2 scholarly works according to:
Citing Articles:
M. Salvadori, A. Tsalouchos - World journal of transplantation (2022) Semantic Scholar
Current Opinion in Organ Transplantation (2019) Crossref Semantic Scholar OpenAlex