
Social Capital and Health Outcomes of Elderly People
Abstract
Greater social capital has been shown to be associated with improved mental health, general wellbeing and reduced risk of premature mortality, cancer mortality and cardiovascular mortality. However, most of these studies found a positive relationship between social capital and health are limited to descriptive studies. This project is performing a theoretical approach to the role of social capital in producing health outcome based on Becker’s household production function.
We are testing whether social capital has a positive impact on health both directly through a more effective production of health and indirectly through utilizing the health care system better, using several measurements of social capital from ‘social support’ module in the National Health and Nutrition Examination Survey (NHANES) 2007-2008 for a sample of those 60 years old and above. NHANES is a unique data set in terms of collecting both subjective self-rated health status and several objective health outcome measurement through medical and laboratory examination.
Finding from 2SLS with instrumental variable was a bit surprising – various social capital measures do not show significant results in different experiments. The only exception is that more resources of emotional support can promote better overall health status.
Author Contributions
Academic Editor: Pengcheng Han, Dignity Health St Joseph Hospital and Medical Center, USA
Checked for plagiarism: Yes
Review by: Single-blind
Copyright © 2018 Bosu Seo, et al.
 This is an open-access article distributed under the terms of the Creative Commons Attribution License, which permits unrestricted use, distribution, and reproduction in any medium, provided the original author and source are credited.
Competing interests
The authors have declared that no competing interests exist.
Citation:
Introduction
“Why treat people’s illness without changing what makes them sick in the first place?” World Health Organization poses this question, suggesting that without modifying the social determinants of health, health care and medicine may be useless 1. Social determinants of health examines why, in countries all over the world, there is a social gradient when it comes to health status and outcomes. Individuals higher up in the social hierarchy consistently have better health outcomes than those lower down.
Social capital was explored as a social determinant of health in the public health domain and has become a popular topic in the past decade particularly with the publication of Putnam’s Bowling Alone (2000). Robert Putnam defined social capital as social networks and the associated norms of reciprocity, which is inhering both in the individual and the collective 2, 3. Ichiro Kawachi attempted to normalized definitions and methodologies of measurement of social capital in the health field 4, 5. In Kawachi’s definition, social capital can be examined as a group or community-level characteristic, called “social cohesion”, or as an individual characteristic using network theory. He also separated bonding and bridging social capital. Bonding social capital refers to the social connectedness within a group whose members are alike in some ways (i.e. race or ethnicity, class, language) and bridging social capital is social connectedness that crosses groups or other boundaries of social attribute 6.
A growing body of literature has analyzed the concept of social capital and its impact on health outcomes and has attracted the attention of both the academic and the policy communities. For example, greater social capital has been shown to be associated with better levels of general health and (subjective) well-being, lower cardiovascular and cancer mortality, and lower suicide rates 7, 8, 9, 10, 11, 12, 13.
In this paper, we will explore social capital from the perspective of an individual resource and social connectedness, which refers to the relationships people have with others a. People enjoy constructive relationships with others in their families, communities, churches, and workplaces. Families support and nurture those in need of care. Social connectedness is integral to wellbeing. People are defined by their social roles, whether as partners, parents, children, friends, caregivers, teammates, staff or employers, or a pile of other roles. Relationships give people support, happiness, contentment and a sense they belong and have a role to play in society 14. They also mean people have support networks in place that they can call on for help during times of illness or poor health.
Most of the recent studies found a positive relationship between social capital and health in general, but they are limited to descriptive studies. The focus in this paper is on a theoretical approach to the role of social capital in producing health based on Becker’s household production function. This study is testing whether social capital has a positive impact on health status both directly through a more effective production of health and indirectly through utilizing the health care system better, using several measurements of social capital from the National Health and Nutrition Examination Survey (NHANES) 2007-2008 for a sample of those 60 years old and above b.
A main reason to consider social capital in light of social networks/ connectedness of elderly people is that networks might enhance positive outcomes for seniors. Previous research reflects strong themes about the importance of family members and friends in the lives of older adults. Social ties have been linked to beneficial health and social outcomes, to the maintenance of independence in later life, and to responsive care for seniors with chronic long-term health problems 15, 16, 17. It is also timely to examine the relationship between social capital and better heath in elderly people with the advent of the baby-boom generation’s aging and retirement. However, there has been little research on the impact of social connectedness in older adults, except Keating et al. 18.
In the literature, studies utilize subjective self-rated health status to explore the relationship between social capital and health. However, NHANES 2007-2008 allows us to use several objective measures, including medical and laboratory examination results as well as self-rated health status. These objective measures will allow us to conduct a more rigorous study about the impact of social capital on health outcomes.
Theoretical Background
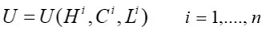
The proximate determinants of an individual’s health usually are decisions made by the individual or by the household in which people live- given assets, prices, and community endowments. Therefore, a natural starting point is the determination of individual health at the household level. Similar to Behrman and Deolalikar (1988), this project is based on the standard household model with constrained maximization of a joint utility function 19, 20. It is assumed that the household behaves as if it maximizes a utility function, which is a function of the goods and services consumed, health status of household members, and leisure c.
A household behaves as if maximizing a utility function:
 (1)
(1)
where
 is the health of household member i ,
 is the consumption of household member i ,
 is the leisure of household member i , and
 is the number of individuals in the household.
(All of these variables and others defined below may be vectors with multiple dimensions.)
Health is a household-produced commodity. The health of the given i th individual is produced by a number of choices relating to the commodities consumed, health inputs, which do not affect utility except through health (e.g. health insurance), and the individual and household endowments:
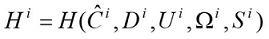 (2)
(2)
where
 is the health outcome of the i th individual,
 is the consumption of the i th individual that affects health,
 is the observable characteristics including socio-demographic variables of the i th individual
 is the unobservable attributes, such as genetic endowment of the i th individual,
 is the characteristics of household, and
 is the social capital of i th individual .
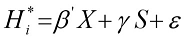
To analyze the basic correlation between social capital and health, we estimate the following regression:
 (3)
(3)
where H*i is the individual's actual health, x is a vector of explanatory variables, S is a vector of social capital, β' is the vector of coefficients, and is the error term. Explanatory variables include socio-demographic variables and genetic endowment variables (X), and social capital (S). Detailed variable lists are found in the appendix.
Data.
The National Center for Health Statistics (NCHS), part of the Centers for Disease Control and Prevention (CDC), has collected nationally representative health and nutrition surveys since the early 1960’s. In each survey a nationally representative sample of the US civilian non-institutionalized population was selected using a complex, stratified, multistage probability cluster sampling design. Primary sampling units (PSU) are generally single counties, although small counties are combined to meet a minimum population size. Clusters of households are selected, the households are screened for demographic characteristics, a sample of households is selected, and one or more persons per household are selected d.
Survey workers collected demographic data and information on general health, use of health services, and housing characteristics in an interview in the home. Nearly three-quarters of the participants also received a four-hour medical examination at a mobile Medical Exam Center (MEC). The MECs, including 12 physicians and other persons involved with the examinations, moved from city to city, preserving consistency in the medical exam. In addition to the MEC examinations, a small number of survey participants receive an abbreviated health examination in their homes because they are not able to come to the MEC. The survey included many tools to induce those selected for the study to participate, especially those selected for the medical exam portion of the survey.
For NHANES 2007-2008, 10,149 persons were interviewed and 9,762 were examined in the MEC. Data were collected between January 2007 and December 2008. The data and corresponding documents for the survey interview and examination components are available from the CDC website.
Methods and Variables
NHANES household, interview, and examination data files were merged using the unique sequence number given to each participant. Samples were weighted using the procedure recommended in the NHANES documentation. In this study, a sample of those 60 years old and above will be analyzed. The total sample size is 1,684 and 815 of them are males and 869 are females. Table 1 shows the definition of variables used in this study.
Table 1. Definition of variables used in the analyses| VARIABLES | DEFINITIONS | Mean (or percentage in decimal) |
| Dependent Variables | ||
| 1) Overall | =1 if overall health status is excellent, very good, or good; else=0 (fair or poor) | 0.700 |
| 2) Phyhealth | =1 if numbers of physical health was not good during the past 30 days >0; else =0 | 0.363 |
| 3) Menhealth | =1 if numbers of mental health was not good during the past 30 days >0; else =0 | 0.249 |
| 4) Biorisk | summary index of biological risk (inflammation, metabolic, and cardiovascular factors) | 1.927 |
| Independent Variables | ||
| Age | Age at Screening | 72.774 |
| Male | =1 if survey participant (SP) is male | 0.476 |
| Race | ||
| White (reference variable) | =1 if SP is Non-Hispanic White | 0.623 |
| Black | =1 if SP is Non-Hispanic Black | 0.168 |
| Mexican | =1 if SP is Mexcican American | 0.155 |
| Other | =1 if SP is Other Hispanic American, Asian, or Multirace | 0.053 |
| Education | ||
| LSHS (reference variable) | =1 if level of educationis less than high school | 0.394 |
| HS | =1 if level of education is high school,inlcuding GED | 0.235 |
| MTHS | =1 if level of education is more than high school | 0.363 |
| Country of Birth | ||
| USborn (reference variable) | =1 if country of birth is US | 0.858 |
| Mexicobn | =1 if country of birth is Mexico | 0.067 |
| Otherbn | =1 if country of birth is somewhere else | 0.073 |
| Married | =1 if marital status is either married or lived with partners | 0.563 |
| HHINC | Annual Household Income (Recode) | 5.720 |
| Famhis | =1 if either blood relatives have disbetes or blood relatives have Alzheimer's | 0.495 |
| Social capital measures | ||
| Ssnum | Numers of sources that give emotional support | 1.947 |
| Emoss | =1 if anyone to help with emotional support | 0.941 |
| Finss | =1 if anyone to help with financial support | 0.826 |
| Anyss | =1 if either Emoss=1 or Finss=1 | 0.960 |
| Numfriends | Number of close friends | 7.103 |
| Instrumental variable | ||
| Longres | =1 if years of residence at the current address >2 years | 0.867 |
Dependent Variable
We use several health outcome measures as dependent variables. The first measure is peoples’ self-rated health status. Measures of self-rated health are based on individual and robust predictors that have gained in popularity to forecast individual health outcomes, even in persons without prior health problems. Previous research has shown that self-rated health status has predicted such important patient outcomes as mortality and health system utilization 21, 22, 23.
In the NHANES data, people were asked: “How is your health in general? Would you say it is excellent, very good, good, fair, or poor?” We converted the original 5-point scale to a dichotomous variable, with the value 1 representing excellent, very good, or good health, and the value 0 representing fair and poor health. A probit model is used for the empirical analysis.
Second, the current health status section (variable name prefix HSQ) of the NHANES questionnaire provides personal interview data on recent illness for the past 30 days, blood donations, and AIDS testing. We chose select recent illness measures, which indicated the number of days that a person’s health condition was not good during the past 30 days. It was collected based on physical and mental health separately.
Third, data based on nine biomarkers were used to create an overall summary index of biological risk, to reflect the cumulative effect of physiological problems across multiple systems. We used three subscales based on subsets of biomarkers reflecting inflammatory, metabolic and cardiovascular parameters. The inflammation subscale included C-reactive protein (mg/dL) and albumin (g/dL). The metabolic subscale included glycated hemoglobin (%), total cholesterol (mg/dL), HDL cholesterol (mg/dL), and Body mass index (kg/m2). The cardiovascular subscale included systolic blood pressure (mm Hg), diastolic blood pressure (mm Hg), and heart rate (bt/min). For each of the variables, a dichotomous indicator was created, reflecting those with “high risk” values (assigned a score of “1”) and “lower risk” values (assigned a score of “0”). Values assigning high and low risk were based on clinically accepted “high risk” criteria. The summary, multi-system score was created by summing the subscale scores.
Table 2. Clinically-defined “high risk” criteria for biologic risk factors| Indicators | High-risk cutoff point |
| Inflammation | |
| Albumin | < 3.8 g/dL |
| C-reactive protein | ≥ 0.3 mg/dL |
| Metabolic | |
| Body mass index | ≥ 30.0 kg/m2 |
| Total cholesterol | ≥ 240 mg/dL |
| HDL cholesterol | < 40 mg/dL |
| Glycated Hemoglobin | ≥ 6.4 % |
| Cardiovascular | |
| Heart Rate | ≥ 90 bt/min |
| Systolic Blood pressure | ≥ 140 mm Hg |
| Diastolic Blood pressure | ≥ 90 mm Hg |
Independent variables
A key independent variable is the social capital measure. NHANES 2007-2008 includes ‘social support’ module. Table 3 shows the questionnaire lists for the ‘social support’ module collected in the NHANES 2007-2008 e. Measures of social capital are number of emotional support sources, emotional/financial support from any source, and number of close friends f, g.
Other independent variables include socio-demographic variables and genetic endowment variables. First, a number of socio-demographic variables were controlled in the equation. The variables to be included are: Gender, Age, Race/Ethnicity, Country of Birth (Foreign born or not), Education, Annual Household Income, and Marital status. Second, we also include a few genetic endowment variables, such as family disease history. These variables are h:
Blood relatives have diabetes
Blood relatives have Alzheimer’s
Table 3. Social support questionnaire variable list| Item # | Data File | Component | Questionnaire |
| 980 | SSQ-B | Social support | Anyone to help with emotional support |
| 981 | SSQ-B | Social support | Spouse gives most emotional support |
| 982 | SSQ-B | Social support | Daughter gives most emotional support |
| 983 | SSQ-B | Social support | Son gives most emotional support |
| 984 | SSQ-B | Social support | Sibling gives most emotional support |
| 985 | SSQ-B | Social support | Parent gives most emotional support |
| 986 | SSQ-B | Social support | Other relative gives most emotional support |
| 987 | SSQ-B | Social support | Neighbors give most emotional support |
| 988 | SSQ-B | Social support | Co-workers give most emotional support |
| 989 | SSQ-B | Social support | Chorch members give most emotional support |
| 990 | SSQ-B | Social support | Club members give most emotional support |
| 991 | SSQ-B | Social support | Professional give most emotional support |
| 992 | SSQ-B | Social support | Friends give most emotional support |
| 993 | SSQ-B | Social support | Others give most emotional support |
| 994 | SSQ-B | Social support | No one gives most emotional support |
| 995 | SSQ-B | Social support | Needed more support last year |
| 996 | SSQ-B | Social support | How much more support needed |
| 997 | SSQ-B | Social support | Anyone to help with financial support |
| 998 | SSQ-B | Social support | Number of close friend |
Results
Descriptive Statistics
The descriptive statistics of all variables are presented in Table 4. The columns of Table 4 break out a sample of those 60 years old and above into three groups: total group, males only, and females only. The total sample size is 1,684 and 815 of them are males and 869 are females.
Table 4. Descriptive Statistics: NHANES 2007-2008| Variables | Total group | Males | Females | |||||||
| N | Mean or % | Stdev | N | Mean or % | Stdev | N | Mean or % | Stdev | ||
| Dependent Variables | ||||||||||
| Overall Health | 1684 | 815 | 869 | |||||||
| Excellent | 9.5% | 10.6% | 8.5% | |||||||
| Very Good | 24.3% | 24.4% | 24.2% | |||||||
| Good | 36.2% | 35.8% | 36.6% | |||||||
| Fair | 23.8% | 22.9% | 24.6% | |||||||
| Poor | 6.1% | 6.1% | 6.0% | |||||||
| Don't know | 0.1% | 0.1% | 0.1% | |||||||
| # of Days not good | ||||||||||
| Physical health | 1683 | 5.95 | 12.25 | 815 | 5.26 | 11.79 | 868 | 6.61 | 12.63 | |
| Mental health | 1682 | 3.44 | 10.10 | 815 | 2.44 | 7.49 | 867 | 4.38 | 11.98 | |
| # of Inactive Days | 1681 | 2.53 | 9.04 | 815 | 2.25 | 8.04 | 866 | 2.80 | 9.89 | |
| Independent Variables | ||||||||||
| Age | 1872 | 71.06 | 1138.00 | 891 | 70.44 | 1033.99 | 981 | 71.52 | 1220.00 | |
| HH Annual Income (coded)a) | 1643 | 6.63 | 804 | 7.13 | 839 | 6.24 | ||||
| Married | 1868 | 54.0% | 889 | 72.4% | 979 | 37.2% | ||||
| Race/Ethnicty | ||||||||||
| Non-Hispanic White | 1164 | 62.2% | 557 | 62.5% | 607 | 61.9% | ||||
| Non-Hispanic Black | 310 | 16.6% | 147 | 16.5% | 163 | 16.6% | ||||
| Mexican American | 291 | 15.5% | 137 | 15.4% | 154 | 15.7% | ||||
| Other Hispanic | 61 | 3.3% | 27 | 3.0% | 34 | 3.5% | ||||
| Other Race - Including Multirace | 46 | 2.5% | 23 | 2.6% | 23 | 2.3% | ||||
| Education | ||||||||||
| LT HS | 738 | 39.5% | 362 | 40.7% | 376 | 38.4% | ||||
| HS Grad (Including GED) | 439 | 23.5% | 175 | 19.7% | 264 | 27.0% | ||||
| MT HS | 679 | 36.4% | 349 | 39.3% | 330 | 33.7% | ||||
| Refused | 4 | 0.2% | 1 | 0.1% | 3 | 0.3% | ||||
| Don't know | 8 | 0.4% | 2 | 0.22 | 6 | 0.61 | ||||
| Emotional Support | ||||||||||
| Anyone helps | 1727 | 92.5% | 813 | 91.5% | 914 | 93.5% | ||||
| Spouse | 817 | 43.6% | 550 | 61.7% | 267 | 27.2% | ||||
| Daughter | 801 | 42.8% | 300 | 33.7% | 501 | 51.1% | ||||
| Son | 620 | 33.1% | 260 | 29.2% | 360 | 36.7% | ||||
| Sibling | 286 | 15.3% | 104 | 11.7% | 182 | 18.6% | ||||
| Parent | 27 | 1.4% | 14 | 1.6% | 13 | 1.3% | ||||
| Relatives | 224 | 12.0% | 78 | 8.8% | 146 | 14.9% | ||||
| Neighbor | 74 | 4.0% | 25 | 2.8% | 49 | 5.0% | ||||
| Co-worker | 21 | 1.1% | 10 | 1.1% | 11 | 1.1% | ||||
| Church | 149 | 8.0% | 62 | 7.0% | 87 | 8.9% | ||||
| Club member | 9 | 0.5% | 6 | 0.7% | 3 | 0.3% | ||||
| Professional | 30 | 1.6% | 9 | 1.0% | 21 | 2.1% | ||||
| Friends | 454 | 24.3% | 172 | 19.3% | 282 | 28.7% | ||||
| Others | 56 | 3.0% | 21 | 2.4% | 35 | 3.6% | ||||
| Needed more emotional support | 233 | 13.5% | 87 | 10.7% | 146 | 16.0% | ||||
| How much more | ||||||||||
| A lot | 50 | 21.5% | 19 | 21.8% | 31 | 21.2% | ||||
| Some | 93 | 39.9% | 34 | 39.1% | 59 | 40.4% | ||||
| A little | 90 | 38.6% | 34 | 39.1% | 56 | 38.4% | ||||
| Financial support | 1872 | 79.2% | 891 | 75.7% | 981 | 82.4% | ||||
| How many close friends | 1840 | 7.94 | 1122.27 | 878 | 8.32 | 1214.42 | 962 | 7.64 | 1029.12 | |
Self-rated health status shows similar patterns between males and females. About 70% of study participants evaluate themselves as either in excellent, very good, or good health (70.8% for males and 69.3 % for females).
However, other health outcome measurements have a different distribution between males and females. Males usually show better health outcome than females. Males have 5.26 days of physical health that was not good during the past 30 days and 2.44 days of mental health that was not good during the past 30 days, while females have 6.61 days for poor physical health and 4.38 days for poor mental health. Males have less days of inactive days due to physical/mental health during the past 30 days (2.25 for males and 2.80 for females). Less than 5% of men had stomach or intestinal illness during the past 30 days, but almost twice as many women experienced it (7.6%). Regarding flu, pneumonia, or ear infection, in contrast to 4.1% of women, only 3.2% of males experienced these ailments during the past 30 days.
Females are generally older than males by one year, have lower household annual income, and fewer females completed education surpassing high school (33.7% for females and 39.3% for males). One interesting finding from the socio-demographic variables is marital status. Only 37.2% of females are married while 72.4% of males are married and this is mainly due to the fact that the sample is adults 60 years old and above: women live longer than men and some females stay widowed once they lose their spouse. Also, a lower rate of second marriage for females may explain the gap.
The race/ethnicity variable is derived by combining responses to questions on race and Hispanic origin. Sixty two percent of total group are Non-Hispanic White, 16.6% Non-Hispanic Black, 15.5% Mexican American, 3.3% Other Hispanic, and 2.5% of them are other race, including multi-race. This distribution still applies when the total sample is divided into males only and females only.
Regarding social capital related factors, both males and females express similar responses. First, 91.5% of males and 93.5% of females have someone to help with emotional support in the last 12 months. Common resources of emotional support are spouse, children, and friends. More women needed more emotional support than males (16.0% for females and 10.7% of males) and around 60% of both males and females needed either a lot or some more emotional support (60.9% for males and 61.6% for females). Women also received more financial support in the past year than men (75.7% for males and 82.4% for females). Males have more close friends than females (8.32 for males and 7.64 for females).
Endogeneity Issues
Social capital measurements should be treated as endogenous variables in the analysis, since a person’s health is likely to affect their social interaction. An estimation approach that does not explicitly address the simultaneous process will bias the estimated relationship between health outcome and the explanatory variables.
The standard econometric procedure for handling endogeneity is some type of instrumental variables (IV) estimator, which is often employed in cross-sectional studies. Mostly two-stage least squares (TSLS) is employed, assuming an appropriate instrument is available. Instrumental variables should be theoretically correlated with the endogenous explanatory variables but not correlated with the error terms.
One potential instrumental variable available in NHANES is the number of years the person has lived at their current address i. The longer the person has lived at their current address, the more likely they build social capital. However, this variable reflects past choices by the individual at certain point of time, so it is not correlated with the error term.
Conclusion and Discussion
We have obtained MLE estimates of the coefficients for the probit regressions with instrumental variables predicting overall health status, physical health and mental health during the past 30 days separately j. The last two dependent variables can imply recent illness. 2SLS was utilized to obtain the estimate of the coefficients predicting index of biological risk factors. Regression results of the health demand equation are presented in Table 5-1 to Table 5-4.
Table 5-1. Health demand equation (Dependent variable: Overall Health Status)| Equation 1 | Equation 2 | Equation 3 | Equation 4 | Equation 5 | ||||||
| ( Obs =1,474) | ( Obs =1,456) | ( Obs =1,419) | ( Obs =1,463) | ( Obs =1,462) | ||||||
| Estimate | Pr > |Z| | Estimate | Pr > |Z| | Estimate | Pr > |Z| | Estimate | Pr > |Z| | Estimate | Pr > |Z| | |
| age | -0.011 | 0.097* | -0.006 | 0.857 | -0.027 | 0.207 | -0.027 | 0.858 | -0.023 | 0.929 |
| male | 0.221 | 0.215 | -1.023 | 0.721 | 0.359 | 0.459 | 2.235 | 0.885 | -1.051 | 0.939 |
| black | -0.417 | 0.003*** | -0.474 | 0.547 | -0.619 | 0.058* | -0.223 | 0.897 | -16.247 | 0.941 |
| mexican | -0.495 | 0.004*** | -1.128 | 0.616 | -0.381 | 0.076* | 1.841 | 0.904 | -9.539 | 0.939 |
| otherrace | -0.545 | 0.033** | 0.825 | 0.824 | -0.418 | 0.196 | -2.722 | 0.865 | -7.905 | 0.938 |
| mexicoborn | -0.759 | 0.001*** | -4.194 | 0.679 | -0.558 | 0.070* | 5.513 | 0.895 | -6.256 | 0.934 |
| otherborn | 0.036 | 0.873 | 0.005 | 0.996 | 0.116 | 0.669 | 0.102 | 0.965 | -7.461 | 0.943 |
| hs | (dropped)a) | (dropped) | (dropped) | (dropped) | (dropped) | |||||
| mths | (dropped) | (dropped) | (dropped) | (dropped) | (dropped) | |||||
| married | -0.439 | 0.038** | 1.157 | 0.751 | -0.145 | 0.322 | -2.363 | 0.877 | 8.970 | 0.942 |
| hhinc | 0.114 | 0.001*** | 0.347 | 0.528 | 0.049 | 0.586 | -0.372 | 0.913 | 0.967 | 0.932 |
| famhis | -0.009 | 0.927 | -0.218 | 0.728 | -0.069 | 0.563 | 0.107 | 0.946 | 0.245 | 0.959 |
| Social capital measures | ||||||||||
| ssnum | 0.851 | 0.080* | ||||||||
| emoss | -39.213 | 0.725 | ||||||||
| finss | 4.843 | 0.354 | ||||||||
| anyss | 107.935 | 0.883 | ||||||||
| numfriends | -5.824 | 0.941 | ||||||||
| Equation 1 | Equation 2 | Equation 3 | Equation 4 | Equation 5 | ||||||
| ( Obs =1,468) | ( Obs =1,450) | ( Obs =1,413) | ( Obs =1,457) | ( Obs =1,456) | ||||||
| Estimate | Pr > |Z| | Estimate | Pr > |Z| | Estimate | Pr > |Z| | Estimate | Pr > |Z| | Estimate | Pr > |Z| | |
| age | 0.005 | 0.374 | 0.001 | 0.992 | 0.020 | 0.360 | 0.013 | 0.825 | 0.004 | 0.937 |
| male | -0.357 | 0.023** | 0.438 | 0.841 | -0.558 | 0.256 | -1.139 | 0.802 | 0.069 | 0.971 |
| black | 0.006 | 0.963 | 0.082 | 0.883 | 0.189 | 0.544 | -0.124 | 0.867 | 4.875 | 0.884 |
| mexican | 0.345 | 0.021** | 0.739 | 0.655 | 0.291 | 0.128 | -0.647 | 0.884 | 2.796 | 0.872 |
| otherrace | 0.169 | 0.435 | -0.657 | 0.801 | 0.074 | 0.800 | 0.96 | 0.825 | 2.381 | 0.88 |
| mexicoborn | 0.037 | 0.85 | 2.181 | 0.767 | -0.147 | 0.623 | -2.448 | 0.833 | 1.95 | 0.886 |
| otherborn | 0.124 | 0.507 | 0.149 | 0.846 | 0.091 | 0.706 | 0.045 | 0.961 | 2.371 | 0.882 |
| hs | (dropped) | (dropped) | (dropped) | (dropped) | (dropped) | |||||
| mths | (dropped) | (dropped) | (dropped) | (dropped) | (dropped) | |||||
| married | 0.205 | 0.273 | -0.766 | 0.771 | -0.145 | 0.322 | 0.879 | 0.834 | -2.761 | 0.884 |
| hhinc | -0.018 | 0.271 | -0.156 | 0.723 | 0.049 | 0.586 | 0.164 | 0.858 | -0.283 | 0.872 |
| famhis | -0.034 | 0.669 | 0.109 | 0.817 | -0.069 | 0.563 | -0.117 | 0.862 | -0.107 | 0.913 |
| Social capital measures | ||||||||||
| ssnum | -0.514 | 0.222 | ||||||||
| emoss | 24.323 | 0.764 | ||||||||
| finss | -4.173 | 0.427 | ||||||||
| anyss | -42.537 | 0.834 | ||||||||
| numfriends | 1.783 | 0.884 | ||||||||
| Equation 1 | Equation 2 | Equation 3 | Equation 4 | Equation 5 | ||||||
| ( Obs =1,469) | ( Obs =1,451) | ( Obs =1,414) | ( Obs =1,458) | ( Obs =1,457) | ||||||
| Estimate | Pr > |Z| | Estimate | Pr > |Z| | Estimate | Pr > |Z| | Estimate | Pr > |Z| | Estimate | Pr > |Z| | |
| age | -0.009 | 0.149 | -0.005 | 0.848 | -0.024 | 0.284 | -0.02 | 0.841 | -0.01 | 0.906 |
| male | -0.117 | 0.471 | -1.097 | 0.640 | 0.095 | 0.850 | 1.319 | 0.899 | -0.824 | 0.882 |
| black | -0.129 | 0.309 | -0.201 | 0.762 | -0.335 | 0.318 | 0.038 | 0.978 | -9.271 | 0.923 |
| mexican | -0.140 | 0.381 | -0.627 | 0.727 | -0.082 | 0.715 | 1.527 | 0.880 | -5.004 | 0.922 |
| otherrace | -0.165 | 0.476 | 0.917 | 0.765 | -0.169 | 0.618 | -1.755 | 0.872 | -4.348 | 0.923 |
| mexicoborn | 0.048 | 0.824 | -2.704 | 0.748 | 0.271 | 0.406 | 4.616 | 0.871 | -3.379 | 0.927 |
| otherborn | 0.022 | 0.913 | -0.002 | 0.999 | 0.104 | 0.708 | 0.069 | 0.968 | -4.263 | 0.926 |
| hs | (dropped) | (dropped) | (dropped) | (dropped) | (dropped) | |||||
| mths | (dropped) | (dropped) | (dropped) | (dropped) | (dropped) | |||||
| married | -0.325 | 0.096* | -0.766 | 0.771 | -0.112 | 0.463 | -1.738 | 0.868 | 5.121 | 0.925 |
| hhinc | -0.031 | 0.088* | -0.156 | 0.723 | -0.099 | 0.296 | -0.386 | 0.868 | 0.487 | 0.927 |
| famhis | 0.142 | 0.103 | 0.109 | 0.817 | 0.130 | 0.299 | 0.242 | 0.830 | 0.348 | 0.897 |
| Social capital measures | ||||||||||
| ssnum | 0.634 | 0.159 | ||||||||
| emoss | -31.171 | 0.735 | ||||||||
| finss | 4.786 | 0.379 | ||||||||
| anyss | -42.537 | 0.834 | ||||||||
| numfriends | -3.379 | 0.923 | ||||||||
| Equation 1 | Equation 2 | Equation 3 | Equation 4 | Equation 5 | ||||||
| ( Obs =1,438) | ( Obs =1,419) | ( Obs =1,386) | ( Obs =1,427) | ( Obs =1,430) | ||||||
| Estimate | Pr > |Z| | Estimate | Pr > |Z| | Estimate | Pr > |Z| | Estimate | Pr > |Z| | Estimate | Pr > |Z| | |
| age | -0.013 | 0.009*** | -0.002 | 0.985 | -0.021 | 0.258 | -0.011 | 0.046** | -0.015 | 0.316 |
| male | -0.054 | 0.679 | 0.497 | 0.925 | 0.069 | 0.877 | -0.041 | 0.844 | -0.124 | 0.509 |
| black | 0.309 | 0.003*** | 0.511 | 0.775 | 0.212 | 0.489 | 0.349 | 0.011** | -0.702 | 0.879 |
| mexican | -0.122 | 0.129 | 0.374 | 0.928 | -0.145 | 0.314 | -0.016 | 0.948 | -0.704 | 0.796 |
| otherrace | -0.268 | 0.113 | -0.719 | 0.865 | -0.227 | 0.322 | -0.271 | 0.237 | -0.832 | 0.755 |
| mexicoborn | 0.206 | 0.558 | 3.533 | 0.902 | 0.324 | 0.240 | 0.564 | 0.526 | -0.192 | 0.920 |
| otherborn | -0.070 | 0.247 | 0.154 | 0.936 | -0.035 | 0.854 | -0.031 | 0.866 | -0.642 | 0.812 |
| hs | (dropped) | (dropped) | (dropped) | (dropped) | (dropped) | |||||
| mths | (dropped) | (dropped) | (dropped) | (dropped) | (dropped) | |||||
| married | -0.023 | 0.865 | -0.572 | 0.918 | 0.049 | 0.611 | -0.001 | 0.999 | 0.663 | 0.818 |
| hhinc | -0.065 | 0.001*** | -0.232 | 0.874 | -0.099 | 0.224 | -0.081 | 0.145 | -0.003 | 0.991 |
| famhis | 0.254 | 0.001*** | 0.003 | 0.999 | 0.228 | 0.008*** | 0.211 | 0.127 | 0.297 | 0.302 |
| Social capital measures | ||||||||||
| ssnum | 0.173 | 0.614 | ||||||||
| emoss | 28.386 | 0.908 | ||||||||
| finss | 2.025 | 0.673 | ||||||||
| anyss | 4.100 | 0.698 | ||||||||
| numfriends | -0.397 | 0.825 | ||||||||
In general, blacks and Mexican Americans are in poorer health than whites. A similar pattern holds for people who were born in Mexico compared with U.S. born. Each table includes 5 separate regressions with one of five social capital measures: numbers of emotional support sources, emotional support from any source, financial support from any source, either emotional or financial support from any source, and number of close friends. Surprisingly, the social capital measures do not show significant results except in one case. The only exception is that more resources of emotional support can promote better overall health status, as shown in equation 1 in Table 5-1.
Social capital, at least in terms of the variables that are available to measure in the NHANES 2007-2008, do not affect health outcomes of elderly people, at least the ones analyzed in this study. This unexpected finding does not necessarily imply social capital has little impact on health of elderly people. Rather, it opens further questions of refining the models and statistical analysis, including exploring other omitted variables. Maybe our instrumental variable was not suitable for the analyses. Or we may have to accept that the basic hypothesis regarding the effect of social capital on health may simply be rejected in this particular case.
In terms of future research on this topic, we plan to use factor analysis to extract common factors in defining social capital. Factor analysis is a method of data reduction. It does this by seeking underlying unobservable (latent) variables that are reflected in the observed variables (manifest variables). In this study, we used a summary index of biological risk factor using nine indicators. We will utilize other indexing methods and define separate inflammation risk, metabolic risk, and cardiovascular risk with other measures k.
References
- 1.World Health Organization(2015)Social determinants of health. , http://www.who.int/social_determinants/en/
- 4.Kawachi I, Subramanian S, Kim D. (2008) . Chapter 1:Social capital and health. In: Social capital and health. Kawachi I and Subramanian S, editors, 1st ed.New York:Springer .
- 5.Kawachi I, Kim D, Coutts A, Subramanian S V. (2004) Commentary: reconciling the three accounts of social capital. , International Journal of Epidemiology 33(4), 682-690.
- 6.Kawachi I, Berkman L. (2000) Social cohesion, social capital and health. , In:L Berkman and I Kawachi (Eds.), Social epidemiology, Oxford:OxfordUniversityPress 1-25.
- 7.Baum F. (1999) Social capital: is it good for your health? Issues for a public health agenda. , Journal of Epidemiology and Community Health 53, 195-196.
- 9.Kawachi I, Kennedy B P. (1997) Health and social cohesion: why care about income inequality?. , British Medical Journal 314, 1037-1040.
- 10.Mohnen S M, Groenewegen P P, Volker B, Flap H. (2011) Neighborhood social capital and individual health. , Social Science and Medicine 72(5), 660-667.
- 11.Murayama H, Fujiwara Y, Kawachi I. (2012) Social capital and health: A review of prospective multilevel studies. , Journal of Epidemiology 22(3), 179-87.
- 12.Poortinga W. (2006) Social capital: An individual or collective resource for health”. , Social Science and Medicine 62(2), 292-302.
- 13.Veenstra G. (2000) Social capital, SES and health: an individual-level analysis. , Social Science and Medicine 50, 619-629.
- 14.Spellerberg A. (2001) Framework for the Measurement of Social Capital in New Zealand, Research and Analytical Report2001,No.14 Statistics New Zealand:Wellington.
- 15.Bowling A, Farquhar M, Browne P. (1991) Life satisfaction and associations with social network and support variables in three samples of elderly people. , International Journal of Geriatric Psychiatry 6(8), 549-566.
- 16.Havens B, Donovan C, Hollander M. (2001) Policies that have positive or negative impacts on informal care in Canada. Presentation to the International Association of Gerontology. , Vancouver, BC
- 17.Martire L M, Schulz R, Mittelmark M B, Newsom J T. (1999) Stability and change in older adults' social contact and social support: The cardiovascular health study. , Journal of Gerontology: Social Sciences,54B(5): 302-311.
- 18.Keating N, Swindle J, Foster D. (2005) The role of social capital in Aging well, in M. Levesque (Eds.), Social capital in action: Thematic Policy Studies. , Canada
- 20.Behrman J, Deolalikar A. (1999) Health and Nutrition. in Handbook of Development Economics, ed Hollis Chenery and TN Srinivasan(New York:North Holland) 631-711.
- 21.M Hornbrook, Bennett M. (1991) Health Plan Case Mix in Employed Populations: Ambulatory Morbidity and Prescribed Drug Models,In:M Hornbrook(Ed.),Advances. in Health Economics and Health Services Research. Risk-Based Contributions to private Health Insurance,Greenwich,CT:JAI Press. : Vol.12 197-232.