Response of Sorghum Varieties to Organic and Inorganic Fertilizer Strategies in Sudan Savanna of Nigeria: Productivity, Nitrogen, and Water Use Efficiencies
Abstract
Experiments were conducted to evaluate the response of different sorghum varieties to micro-dosing fertilization strategies on yield and yield traits, as well as the impact on nitrogen fertilizer and water use efficiency (NUE and WUE). In addition, the benefit-cost ratio of sorghum cultivation under different fertilization strategies in the Sudan savanna zone of Nigeria was analyzed. The experiment included eight fertilizer micro-application strategies as well as two control and three sorghum varieties. Our results showed that most agronomic indicators differed significantly between years, varieties, and fertilization strategies. However, the application of 100g hill-1 poultry manure plus 3g NPK hill-1 resulted in the highest average grain yield > 2000 kg ha-1 at both study sites (BUK and Minjibir). This means that the grain yield is 86% and 132% higher than the average grain yield with zero fertilization. There were extremely significant differences between NUE and WUE fertilization strategies and varieties at the two sites. At BUK and Minjibir, NPK applied with 3 g of hill-1 had the highest NUE with an average of 37.6 and 40 kg grain/kg N. Application of 100 g of poultry manure plus 3g of NPK hill-1 resulted in the highest average WUE of 6.1 and 5.6 kg grain/mm for BUK and Minjibir, respectively. BUK (3.2) and Minjibir (3.6) had the highest net income and benefit-to-cost ratios when applying 3 grams of NPK per hill. The adoption of micro-dosing fertilization strategies by smallholder farmers provides a good opportunity to prevent long-term soil fertility limitations and thereby increase sorghum productivity and farmer incomes by recommending multiple-choice fertilization strategies for improved sorghum varieties.
Author Contributions
Academic Editor: Giorgio Masoero, Accademia di Agricoltura di Torino, Torino, Italy
Checked for plagiarism: Yes
Review by: Single-blind
Copyright © 2024 Hakeem A. Ajeigbe, et al
 This is an open-access article distributed under the terms of the Creative Commons Attribution License, which permits unrestricted use, distribution, and reproduction in any medium, provided the original author and source are credited.
Competing interests
The authors declare that the research was conducted in the absence of any commercial or financial relationships that could be construed as a potential conflict of interest. However, there is no conflict of interest among the authors of the manuscript.
Citation:
Introduction
Sorghum (Sorghum bicolor (L) Moench) is an important food for millions of people in the semi-arid tropics of Africa, Asia, and Latin America and is an important crop in these regions. Sorghum is a versatile crop, with millet used for human consumption and animal feed, fodder millets used for greens and feed, and sweet millets providing fiber, raw materials, and biofuels 10. Due to its deep root system, it is more drought tolerant than rice, corn, and wheat. This allows it to adapt to growing in water-scarce environments. In 2018, Nigeria planted 5.9 million hectares of sorghum with an estimated production of 6.66 million tonnes, equivalent to 1.13 tonnes ha-117, making the country the leading sorghum producer in Africa and the second largest in the world after the United States. Although Nigeria is the second largest sorghum producer in the world, most sorghum production is carried out by smallholder farmers who use traditional varieties and often add little or no fertilizer to the soil 2. 2 reported that the adoption of improved sorghum varieties by farmers in northern Nigeria is about 25%, with only 23% adopting these varieties along with good agronomic practices (GAP). This results in less nutrients in the soil available to plants, resulting in low yields. The average grain yield of sorghum in farmers’ fields in the Sudanese grassland region of Nigeria is slightly more than 1000 kg ha−1 3. The use of chemical fertilizers is one of the main factors that significantly increases yields 39. Nutrient inputs from organic and inorganic fertilizer sources are required to replace and replenish nutrients lost to the soil system due to uptake by plants during production. The use of organic and inorganic fertilizers to increase sorghum yields has been found to improve growth performance as well as soil chemistry 33. Although fertilizers play a vital role in the growth and development of crops, including sorghum, overapplication is often harmful, leading to lower yields and negatively affecting soil properties 3.
Many smallholder farmers in tropical Africa rarely use inorganic fertilizers to grow food crops such as sorghum due to the high cost of fertilizer purchase and application labour 2, 11. Fertilizer micro-dosing application, i.e. spot application, was developed by the International Crops Research Institute for the Semi-Arid Tropics (ICRISAT) in Niger 37 to achieve the effect of applying small amounts of fertilizer to maximize fertilizer utilization. For use by resource-poor farmers. Microdosing technology has been demonstrated and promoted in many countries in West and Central Africa, with very encouraging results. Compared to agricultural practices, sorghum and millet yields increased by 45% to 120%, while farmer incomes increased by 50% to 130% 38. Nitrogen (N) is the most important and limiting nutrient required by plants in semi-arid soils 15. Therefore, adopting good nitrogen fertilizer management strategies often brings huge economic benefits to farmers. Nitrogen fertilizer contributes more than any other fertilizer source to increasing the yield of cereal crops, including sorghum 13. Phosphorus (P) is the second most important plant nutrient, although its immobile nature makes it less readily available to plants 34.
Nitrogen use efficiency (NUE) in crops is a very complex phenomenon determined by the economic production of a species (cereal, feed, or dual use) and is defined as the amount of biomass and/or grain produced per unit of available nitrogen in the crop. 32, 23. NUE depends on a variety of factors, including application time, nitrogen rate, variety, and climatic conditions 1. The total amount of nitrogen should be divided into appropriate portions to best meet the needs of the sorghum plant for growth. The aim is to avoid an increase in early vegetative growth and promote the development of the uppermost green part, which is directly involved in the formation of the grain. Crop response to nitrogen depends primarily on genotype and its interaction with applied nitrogen fertilizer 29. In intensive agricultural systems, changes in NUE are mainly attributed to differences in nitrogen uptake capacity. In sorghum production, changes in nitrogen use efficiency are driven by changes in nitrogen reuse and utilization efficiency 10. Low sorghum productivity in West African countries, including Nigeria, has also been attributed to several biotic and abiotic factors, including irregular rainfall. 7 and 21 found that although water is a limiting factor in agricultural production, the temporal and spatial distribution of precipitation events has the greatest impact on crop development and agricultural production. Low soil moisture (drought) reduces nutrient uptake by roots and causes nutrient deficiencies by reducing the rate of nutrient diffusion from soil to roots, resulting in limited transpiration rates and affecting active transport and membrane permeability 6. This suggests that an area's soil moisture or rainfall distribution, combined with nutrient availability, plays a crucial role in a crop's water use efficiency (WUE). WUE, described as the ratio of biomass accumulation to water use, is an important indicator of plant productivity in water-scarce environments 36, especially where crop yields are highly dependent on rainfall.
Using micro-dosing application technology, a field trial of 10 fertilization strategies using organic fertilizers, inorganic fertilizer sources, and their combinations was conducted with 2 improved sorghum varieties and 1 local sorghum variety. The objective of this study was to evaluate the impact of fertilization strategies on yield, yield characteristics, nitrogen and water use efficiency (NUE and WUE), and the benefit-cost ratio of sustainable sorghum productivity in the Sudan savanna region of Nigeria. The results of this paper will help us develop appropriate climate adaptation strategies when scaling up small-scale sorghum growing communities, including nutrient recycling to increase sorghum productivity, organic farming, and crop-livestock integration.
Materials and Methods
Description of the Experimental Sites
The experiments were conducted over three growing seasons (2016-2018) at two locations within the Sudan savanna agroecological zone of Nigeria. The first location was the ICRISAT research field situated within the Institute for Agricultural Research (IAR) Station, Wasai, Minjibir (Latitude 12.17° N and Longitude 8.65° E). The second location was the ICRISAT research field situated within Bayero University Kano (BUK) (Latitude 12.98° N and Longitude 9.75° E). Weather data was collected from Campbell Scientific Automated Weather Stations installed within a 2 km radius of the experiment sites.
Experimental Design
The experimental design was a split-split plot with four replications. The year of the experiment was taken as the main plot, fertilizer application strategy as the sub-plot and the sorghum varieties tested the sub-sub-plot. The years of the experiment considered as the main plot were Year 1 (2016), Year 2 (2017), and Year 3 (2018), respectively. The fertilizer sources (organic and inorganic), application strategies (sole and combination), and varying quantities considered as sub-plots are nine fertilizer application strategies and a control (no fertilizer) applied using micro-dossing techniques. The fertilization treatments (Table 1a) include F1 (Control); F2 (Cattle manure 50 g/hill + Poultry manure 50 g/hill); F3 (Cattle manure 100 g/hill); F4 (NPK 80:60:60); F5 (NPK 3 g/hill); F6 (NPK 3 g/hill + Cattle manure 100 g/hill); F7 (Poultry 100 g/hill); F8 (Poultry manure 100 g/hill + NPK 3 g/hill); F9 (Poultry manure 150 g/hill) and F10 (Poultry manure 50 g/hill).The three sorghum varieties tested as sub-sub-plot included: CSR 01, Improved Deko, and Local Kaura. The gross size of each sub-sub plot was 15 m2, (4 rows of 5 m long and rows spaced at 75 cm apart). Sowing was done at 30 cm between hills, having a total plant population of 44,444 hills ha-1.
Table 1a. Fertilizer treatments and their equivalent rate per hectare| Treatment | Treatment description (Rate per hill) | Rate per ha |
|---|---|---|
| F1 | Control | |
| F2 | Cattle manure 50g/hill + Poultry manure 50g/hill | 2.22 t/ha each |
| F3 | Cattle manure 100g/hill | 4.44 t/ha |
| F4 | NPK broadcast/drilled | NPK 80:60:60 |
| F5 | NPK 3g/hill | NPK 15:15:15 (0.133 t/ha) |
| F6 | NPK 3g/hill + Cattle manure 100g/hill | Cattle manure 4.44 t/ha |
| F7 | Poultry manure 100g/hill | Poultry manure 4.44 t/ha |
| F8 | Poultry manure 100g/hill + NPK 3g/hill | Poultry manure 4.44 t/ha + NPK 15:15:15 (0.133 t/ha) |
| F9 | Poultry manure 150g/hill | Poultry manure 6.66 t /ha |
| F10 | Poultry manure 50g/hill | Poultry manure 2.22 t /ha |
Field Management, Data Collection, and Analysis
Soil samples were taken annually at random before the establishment of the experiment at three different depths of 0-20 cm, 20-40 cm, and 40-60 cm, respectively, and analyzed for soil Physico-chemical properties. Organic manure (cattle and poultry) used in the experiment was also analyzed annually for their chemical properties such as total N, available P, exchangeable cations, percentage of organic carbon, and pH before being used for the experiment. The fields were ploughed, disc-harrowed, and ridged at 75 cm inter-row spacing. Sowing was done during the first cropping season on the 18th and 21st of June 2016 at BUK and Minjibir, respectively. In the second cropping season, it was done on the 28th of June at BUK and the 20th of June at Minjibir in 2017. The third cropping season was sown on the 27th of June at BUK and the 20th of June at Minjibir in 2018. Seeds were sown at 5-7 seeds per hole at a depth of 3 cm to 5 cm and thinned to 2 plants per hill at 2-3 weeks after sowing (WAS). To maintain optimum plant population, where necessary, gap filling was done 3 to 4 days after sowing. For the plots with organic fertilizers, all the fertilizers were applied in full at 5 cm from the seed at sowing. For those plots with inorganic fertilizer, micro-doses were applied 5 cm away from the seed at sowing, except for the plots with NPK at the rate of 80:60:60 on which the full doses of P and K together with 60 kg N ha-1 were applied through drilling at sowing, while the balance of 20 kg N ha-1 was applied as Urea at 5 WAS. Weeding was done manually to keep the field weed-free. At both experimental locations, grain and stalk yields were measured from two harvested rows (net plot) at the center of each plot [7.5 m2 area (5 m × 1.5 m)]. Panicles, grain, and stalk were sun-dried for two weeks before threshing. Grain yield (kg ha−1) and 1000 seed weight (g) were determined. All the data were subjected to analysis of variance (ANOVA) using the GENSTAT analytical tool (19th edition). Year; fertilizer type, combination, quantities; and variety were taken as factors to determine the level of significance at 5% probability. Fisher’s least-significant difference (LSD) was computed where the p values were significant at the p = 0.05 level of probability 22.
Water-Use Efficiency
Water use efficiencies of grain for the years of experiment, fertilizer micro-dose application strategies, and the tested varieties between sowing and physiological maturity were calculated. Firstly, we compute daily reference crop evapotranspiration (ETo) using the daily records of minimum temperature. The recommended crop coefficient (Kc) for sorghum was calculated using the methods described by 14 and was multiplied by the computed daily reference evapotranspiration (ETo) using the methods described by 5 to compute crop evapotranspiration (ETc) using equation (1). Therefore, ETc was calculated using the equation below:
ETc = Kc ETo (1)
where,
ETc crop evapotranspiration (mm),
Kc crop coefficient (dimensionless),
ETo reference crop evapotranspiration (mm d-1).
WUE was calculated using the following equations by 28 and was reported as kg grain mm-1 of rain received.
WUE =  (2)
(2)
where,
GY is grain yield (kg ha−1),
ETc is crop evapotranspiration (mm).
Nitrogen Use Efficiency
The nitrogen use efficiency (NUE) was calculated as per the following formula described by 35 and reported as kg grain kg-1 of N applied.
NUE= (3)
(3)
where,
Yf is grain yield (kg ha−1) in the fertilized plot,
Yc is grain yield (kg ha−1) in the control plot,
Na is nitrogen applied (kg ha-1).
Economic analysis of fertilization application strategy on sorghum productivity
For the benefit-cost ratio, the methods described by 16 were adopted, in which the financial concepts are defined by equations (4) and (5), given that total revenue refers to the sum of unit price multiplied by the quantity of grain and stalk yields produced.
Total Revenue (TR) =  (4)
(4)
where
Rg is the revenue generated from grain,
Rs is the revenue generated from the stalk.
Total Cost of Production (CP) is the sum of the costs incurred during the production of the sorghum, such as tillage, planting, crop treatments, herbicides, seeds, and labor, among others.
Net economic returns (NERs) are the difference between TR and TCP.
The benefit-cost ratio was therefore calculated using the below formula:
B:C = (5)where,
TR is the total revenue generated from grain and stalk (Naira ha-1),
TCP is the total cost of production of the sorghum (Naira ha-1).
Results and Discussion
The soil and fertilizer properties during the experiment
The soil types in the experimental sites (Table 1b and Table 1c) were classified as sandy loam in texture for the depths of 0-20 cm and 20-40 cm in both locations. The texture was documented as being loamy sand to loamy clay sand for a depth of 40-60 cm in both locations. This soil textural class falls within the recommended textural classes suitable for producing sorghum. The soil's pH of the locations was between 5.78 and 7.07, with a depth of 40-60 cm in 2016 and 2018 in the same BUK. These pH values are slightly basic to slightly alkaline, which is appropriate to produce sorghum as documented by 27. The experimental areas had low to medium concentrations of soil organic carbon, low concentrations of total nitrogen, and available phosphorus was varied.
Table 1b. Chemical and physical properties of soil at BUK site (2016 - 2018)| Profile depth/ Year | 20cm | 40cm | 60cm | ||||||||||
|---|---|---|---|---|---|---|---|---|---|---|---|---|---|
| 2016 | 2017 | 2018 | 2016 | 2017 | 2018 | 2016 | 2017 | 2018 | |||||
| pH (H2O) | 5.9 | 6.2 | 7.0 | 5.8 | 6.1 | 7.1 | 5.8 | 6.3 | 7.0 | ||||
| pH (CaCl2) | 5.0 | 4.9 | 6.8 | 4.4 | 4.3 | 6.8 | 4.5 | 4.2 | 6.5 | ||||
| N (g/kg) | 1.8 | 0.7 | 0.1 | 1.1 | 0.7 | 0.1 | 1.4 | 1.4 | 0.1 | ||||
| P (mg/kg) | 9.6 | 16.5 | 10.0 | 7.3 | 10.0 | 2.4 | 3.4 | 16.7 | 4.5 | ||||
| K(Cmol/kg) | 0.4 | 0.3 | 0.8 | 0.2 | 0.3 | 0.2 | 0.2 | 0.2 | 0.8 | ||||
| O.C (g/kg) | 5.6 | 5.2 | 0.1 | 3.1 | 7.4 | 0.2 | 5.6 | 3.0 | 0.1 | ||||
| Ca (cmol/kg) | 3.0 | 6.5 | 1.9 | 2.9 | 4.3 | 2.1 | 4.4 | 2.9 | 2.1 | ||||
| Mg (cmol/kg) | 7.4 | 1.6 | 1.4 | 10.3 | 1.2 | 2.0 | 11.5 | 1.3 | 2.1 | ||||
| CEC (cmol/kg) | 15.3 | 10.0 | 4.2 | 17.9 | 7.2 | 4.6 | 20.9 | 5.0 | 5.2 | ||||
| SAND (%) | 78 | 78 | 82 | 74 | 76 | 78 | 66 | 74 | 76 | ||||
| SILT (%) | 11 | 14 | 10 | 9 | 14 | 12 | 9 | 12 | 12 | ||||
| CLAY (%) | 11 | 8 | 8 | 17 | 10 | 10 | 25 | 14 | 12 | ||||
| Texture | Sandy loam | Sandy loam | Loamy sand | Sandy loam | Sandy loam | Sandy loam | Sandy Clay loam | Sandy loam | Sandy loam | ||||
| Profile depth / Year | 20cm | 40cm | 60cm | ||||||
|---|---|---|---|---|---|---|---|---|---|
| 2016 | 2017 | 2018 | 2016 | 2017 | 2018 | 2016 | 2017 | 2018 | |
| pH (H2O) | 6.4 | 6.2 | 6.1 | 6.2 | 6.1 | 6.2 | 5.8 | 6.3 | 6.5 |
| pH (CaCl2) | 5.1 | 4.9 | 6.0 | 4.8 | 4.3 | 5.9 | 4.7 | 4.2 | 6.2 |
| N (g/kg) | 1.1 | 0.7 | 0.1 | 1.8 | 0.7 | 0.1 | 1.4 | 1.4 | 0.1 |
| P (mg/kg) | 12.6 | 16.5 | 12.2 | 5.6 | 10.0 | 9.4 | 5.8 | 16.7 | 2.3 |
| K(Cmol/kg) | 0.1 | 0.3 | 0.8 | 0.1 | 0.3 | 0.9 | 0.1 | 0.2 | 0.7 |
| O.C (g/kg) | 3.4 | 5.2 | 0.3 | 2.5 | 7.4 | 0.3 | 2.7 | 3.0 | 0.5 |
| Ca (cmol/kg) | 1.4 | 6.5 | 0.7 | 1.6 | 4.3 | 0.9 | 2.0 | 2.9 | 1.0 |
| Mg (cmol/kg) | 5.8 | 1.6 | 0.6 | 8.9 | 1.2 | 1.0 | 9.8 | 1.3 | 1.2 |
| CEC (cmol/kg) | 11.7 | 10.0 | 2.3 | 14.8 | 7.2 | 3.0 | 16.1 | 5.0 | 3.2 |
| SAND (%) | 86 | 78 | 94 | 82 | 76 | 86 | 72 | 74 | 80 |
| SILT (%) | 5 | 14 | 2 | 7 | 14 | 10 | 5 | 12 | 8 |
| CLAY (%) | 9 | 8 | 4 | 11 | 10 | 4 | 23 | 14 | 12 |
| Textural class | Loamy sand | Sandy loam | Sand | loamy sand | Sandy loam | Sand | Sandy Clay loam | Sandy loam | Loamy sand |
The cattle manure employed (Table 1d) had a pH that was between 6.2 and 8.4, which is indicative of acidic to basic conditions, while the poultry manure had a pH that was between 8.2 and 9.8, which is indicative of basic to acidic conditions. The pH of the manure was primarily affected by the degree of fermentation or digestion. The higher pH of the poultry manure is also beneficial to soil health in acidic soil, this is of great importance in the maintenance of soil fertility. Also, higher percentages of N were observed in poultry manure, which was between 1.2% and 1.6%, the highest percentage of N was observed in 2018 in cattle manure. The percentage of N in poultry manure was over twice the amount in cattle manure. The poultry's excretion contains both pee and urine, this makes it different than the cattle's manure regarding the N composition. However, the concentration of cattle manure was higher in P and K than that of poultry manure. The chemical composition of the analysis demonstrated the value of poultry manure as a soil enhancer of fertility and would be of great importance in organic farming and the recycling of nutrients. The amount of N per season was determined by analyzing the cattle and poultry manure as well as the inorganic fertilizer (Table 2). The high concentration of poultry manure (150 g per hill) was comparable to about 6 t ha-1, this produced the highest application rate of 95 kgNha-1, which was higher than the recommended rate of 80 kgNha-1. This was followed by hybridization of medium application rates of poultry manure F8 (average of 83 kgNha-1), followed by F10 (average of 32 kg ha-1), F3 (average of 31 kg ha-1), and F5 (average of 20 kg ha-1) had the lowest N application of any fertilizer application.
Table 1d. Chemical properties of manure obtained from cattle dung and poultry manure during 2016 to 2018.| Source | Cattle | Poultry | ||||
|---|---|---|---|---|---|---|
| Year | 2016 | 2017 | 2018 | 2016 | 2017 | 2018 |
| pH | 8.37 | 6.19 | 8.32 | 9.35 | 9.81 | 8.20 |
| EC (dS/m) | 3.18 | 2.82 | 4.81 | 0.91 | 0.85 | 2.97 |
| O.C (%) | 47.88 | 90.97 | 26.45 | 2.59 | 3.78 | 24.38 |
| N (%) | 0.67 | 0.60 | 0.81 | 1.61 | 1.19 | 1.47 |
| P (mg/kg) | 12971 | 12466 | 23995 | 6570 | 4885 | 4965 |
| K (mg/kg) | 12099 | 11729 | 797 | 1026 | 1099 | 779 |
| Ca (mg/kg) | 98.31 | 133.84 | 221.08 | 68.97 | 102.69 | 50.28 |
| Mg(mg/kg) | 92.5 | 54.8 | 59.4 | 101.7 | 66.6 | 111.8 |
| Treatments | Kg N ha -1 | ||||
| Code | 2016 | 2017 | 2018 | Mean | |
| Control | F1 | - | - | - | - |
| Cattle manure (50g/hill) + Poultry manure (50g/hill) | F2 | 51 | 40 | 51 | 47 |
| Cattle manure (100g/hill) | F3 | 30 | 27 | 36 | 31 |
| NPK 80:60:60 | F4 | 80 | 80 | 80 | 80 |
| NPK (3g/hill) | F5 | 20 | 20 | 20 | 20 |
| NPK (3g/hill) + Cattle (100g/hill) | F6 | 35 | 33 | 38 | 35 |
| Poultry (100g/hill) | F7 | 72 | 53 | 65 | 63 |
| Poultry (100g/hill) + NPK (3g/hill) | F8 | 92 | 73 | 85 | 83 |
| Poultry (150g/hill) | F9 | 107 | 79 | 98 | 95 |
| Poultry (50g/hill) | F10 | 36 | 26 | 33 | 32 |
The weather conditions at the experimental sites.
The rainfall was highly variable and followed a single-modal pattern, but a slight drop was observed in July due to a long dry spell in 2016 and 2018 at BUK in 2018 and an early pick of rainfall observed in 2016 and 2017 in Minjibir. More precipitation was received in 2016 and 2017 at Minjibir than it was in BUK, except for 2018 when the precipitation recorded at BUK was higher than at Minjibir. Despite the volume of precipitation received in both experimental sites, most of the precipitation was of short duration and high intensity between June and August, with over 70% of the total precipitation in BUK and 77%-82% of the total precipitation in Minjibir. The total annual rainfall volume received during the experimental periods at the BUK and Minjibir sites was between 439 mm and 573 mm, which is greater than the water requirement for optimal yield of sorghum in the semi-arid region 26. The total volume of rainfall was split between 36 and 53 days. Temperature is another significant weather component that affects crop growth, development, and productivity because of its role in the physical and chemical processes within the plants. These processes, in turn, affect the chemical reactions in the plants. Every plant species has a specific maximum, optimal, and minimum temperature range for its typical growth and development at a particular stage of its life cycle. During the 3-year growing season, the average monthly minimum temperatures ranged from 15.1 to 23.7 °C in the BUK site and 14.5 to 24.4 °C in the Minjibir site (Table 3a and Table 3b). The maximum temperature was between 30.4 and 36.4 °C in BUK, and between 30.4 and 37 °C in Minjibir. The temperature was situated within the reported range of sorghum by 4. This implies that the current study concurred with both higher and lower temperatures and base thresholds for sorghum in both experimental areas.
Table 3a. Average Monthly Minimum and Maximum Temperatures and Total Rainfall for BUK from 2016 to 2018| Month | Min. Temp (⁰C) | Max. Temp (⁰C) | Rainfall (mm) | ||||||
|---|---|---|---|---|---|---|---|---|---|
| 2016 | 2017 | 2018 | 2016 | 2017 | 2018 | 2016 | 2017 | 2018 | |
| Jan | 11.9 | 16.7 | 13.2 | 28.0 | 33.7 | 28.6 | 0 | 3 | 0 |
| Feb | 17.6 | 16.6 | 19.4 | 35.2 | 30.6 | 36.6 | 0 | 0 | 0 |
| Mar | 21.5 | 19.7 | 21.3 | 36.3 | 36.7 | 39.6 | 0 | 0 | 1 |
| Apr | 26.0 | 25.7 | 25.5 | 41.9 | 38.3 | 41.3 | 0 | 16 | 0 |
| May | 25.7 | 25.9 | 25.0 | 38.6 | 37.7 | 37.9 | 62 | 45 | 40 |
| Jun | 23.2 | 23.7 | 23.7 | 33.9 | 33.3 | 35.1 | 177 | 142 | 99 |
| Jul | 22.7 | 22.5 | 22.1 | 31.8 | 31.1 | 31.7 | 78 | 131 | 42 |
| Aug | 21.8 | 22.2 | 21.5 | 30.8 | 30.4 | 30.6 | 238 | 181 | 320 |
| Sep | 22.1 | 22.4 | 22.1 | 32.8 | 32.2 | 32.5 | 87 | 107 | 182 |
| Oct | 21.1 | 19.2 | 21.9 | 36.4 | 34.1 | 35.4 | 7 | 7 | 2 |
| Nov | 18.5 | 15.1 | 16.2 | 35.8 | 32.7 | 34.5 | 0 | 0 | 0 |
| Dec | 16.1 | 15.5 | 14.1 | 31.8 | 29.5 | 30.2 | 0 | 0 | 0 |
| Total rainfall | 648 | 631 | 686 | ||||||
| Number of rainy days (NRD) | 47 | 53 | 47 | ||||||
| Month | Min. Temp (⁰C) | Max. Temp (⁰C) | Rainfall (mm) | ||||||
|---|---|---|---|---|---|---|---|---|---|
| 2016 | 2017 | 2018 | 2016 | 2017 | 2018 | 2016 | 2017 | 2018 | |
| Jan | 12.7 | 15.2 | 13.2 | 28.9 | 33.2 | 26.2 | 0 | 0 | 0 |
| Feb | 15.0 | 16.4 | 17.5 | 33.3 | 36.0 | 35.6 | 0 | 0 | 0 |
| Mar | 24.0 | 22.8 | 18.9 | 39.4 | 40.1 | 39.3 | 0 | 0 | 1 |
| Apr | 25.6 | 26.2 | 24.9 | 41.8 | 41.1 | 40.8 | 0 | 10 | 0 |
| May | 26.1 | 25.9 | 25.9 | 39.1 | 38.0 | 37.6 | 71 | 39 | 29 |
| Jun | 23.5 | 23.7 | 24.4 | 34.1 | 34.3 | 35.8 | 256 | 317 | 65 |
| Jul | 23.0 | 22.4 | 22.5 | 32.5 | 31.8 | 31.8 | 127 | 153 | 112 |
| Aug | 22.0 | 22.4 | 22.1 | 32.5 | 31.4 | 30.9 | 201 | 228 | 329 |
| Sep | 22.2 | 22.7 | 22.5 | 34.0 | 33.5 | 33.1 | 106 | 137 | 72 |
| Oct | 19.1 | 19.5 | 20.9 | 37.0 | 35.4 | 36.4 | 0 | 5 | 8 |
| Nov | 15.1 | 15.5 | 14.5 | 35.6 | 30.4 | 35.7 | 0 | 0 | 0 |
| Dec | 11.7 | 17.3 | 12.7 | 30.8 | 29.8 | 30.0 | 0 | 0 | 0 |
| Total rainfall | 761 | 889 | 616 | ||||||
| Number of rainy days (NRD) | 44 | 42 | 36 | ||||||
Effects of micro-dose fertilization strategies on 1000-seed weight, grain, and stalk yields of sorghum varieties
Table 4 presents the effect of year, fertilizer treatment, and variety on the 1000 seed weight, grain, and stalk yields of sorghum. Significant differences (p = 0.002) were observed between the years of the experiment regarding the weight of 1000 seeds and the yield of grain (p = 0.001) in BUK. However, the years had no significant effect on the stalk yield in BUK or the weight of 1000 seeds, nor the yield of grain or stalk in Minjibir. Local variety had a higher average weight of seeds than improved varieties (30.4 g and 31.5 g at BUK and Minjibir, respectively). The lowest 1000-seed weight (28.6 g and 26.9 g at BUK and Minjibir, respectively) was achieved by improved Deko. The application of fertilizer had no significant impact on the weight of the seed. These outcomes agreed with the findings of 3 reported no significant differences in the 1000-seed weight of sorghums due to the utilization of fertilizer in BUK and Minjibir, Local Kaura sorghum had a higher 1000-seed weight than other varieties from experimental locations. Years, strategies for fertilization, and varieties of sorghum have a significant impact on yields of grain (Table 4). In BUK. In Minjibir, the years had no significant impact on the mean yield of grain crops, but there were significant differences (p < 0.001) between the treatments of fertilizer as well as between the varieties of sorghum. The interaction between the year and the application strategy for fertilizers, as well as the sorghum varieties, was not significant in BUK but was significant in Minjibir. The highest average yield of grain in 2017 was 2.05 million kg ha-1, which increased by 32 percent compared to 2018 and increased by 40 percent compared to 2016, respectively. These findings could be attributed to environmental effects like the soil and weather patterns, particularly the distribution of rainfall that was more beneficial in 2017 than in 2016 and 2018. For example, in the 2017 experimental year, the soil's pH ranges were 6.1- 6.3 (Table 2) across the sampling depths, which are in the appropriate range of soil pH for releasing nutrients that are fast in the soil system 20. Additionally, 70% of the precipitation total was received in 53 days of rain during the experimental period, which was lower in 2016 and 2018, respectively. The volume of rainfall received during the experimental years was found adequate to produce high grain yields, previous findings by 3 reported that the distribution of the rainfall supersedes its total seasonal volume in ensuring higher grain yield is produced.
Table 4. Effect of Year, Fertilizer Application, and Variety on Yields of Sorghum from the Experimental Sites (2016 to 2018)| Treatments / Site | BUK | Minjibir | ||||
| 1000-Seed Weight (g) | Grain Yield (kgha-1) | Stalk Yield (kgha-1) | 1000-Seed Weight (g) | Grain Yield (kgha-1) | Stalk Yield (kgha-1) | |
| Year (Y) | ||||||
| 2016 | 30.0 | 1577 | 8332 | 30.3 | 1391 | 9586 |
| 2017 | 31.3 | 2205 | 8709 | 28.5 | 1504 | 10120 |
| 2018 | 27. 9 | 1669 | 9437 | 29.3 | 1636 | 8420 |
| P of F | 0.002 | <.001 | 0.328 | 0.056 | 0.122 | 0.087 |
| LSD | 1.35 | 116 | 1672 | 1.44 | 243 | 1547 |
| Fertilizer (F) | ||||||
| F1 | 28.8 | 1209 | 6275 | 29.1 | 969 | 6060 |
| F2 | 30.1 | 2023 | 10032 | 28.8 | 1413 | 8492 |
| F3 | 29.8 | 1660 | 8703 | 28.5 | 1119 | 7438 |
| F4 | 30.0 | 1732 | 8724 | 30.2 | 1574 | 11180 |
| F5 | 29.3 | 1860 | 8511 | 29.3 | 1747 | 10836 |
| F6 | 29.6 | 2090 | 9008 | 30.1 | 1661 | 9956 |
| F7 | 30.4 | 1900 | 9527 | 29.7 | 1456 | 9359 |
| F8 | 29.9 | 2243 | 10239 | 28.7 | 2250 | 11688 |
| F9 | 29.1 | 2010 | 9263 | 29.7 | 1606 | 10345 |
| F10 | 29.9 | 1445 | 7978 | 29.5 | 1307 | 8398 |
| P of F | 0.74 | <.001 | <.001 | 0.76 | <.001 | <.001 |
| LSD | 1.71 | 240 | 1624 | 2.02 | 197 | 894 |
| Variety (V) | ||||||
| CSR-01 | 30.4 | 1118 | 9970 | 29.7 | 1064 | 8304 |
| Improved Deko | 28.6 | 2548 | 8219 | 26.9 | 2096 | 11965 |
| Kaura | 30.4 | 1786 | 8289 | 31.5 | 1371 | 7857 |
| P of F | <.001 | <.001 | <.001 | <.001 | <.001 | <.001 |
| LSD | 0.74 | 111 | 632 | 1.15 | 92 | 312 |
| Mean | 29.7 | 1817 | 8826 | 29.4 | 1510 | 9375 |
| CV | 9.7 | 16 | 28 | 15.3 | 24 | 13 |
| Interactions | ||||||
| Y x F | ns | * | ns | ns | ** | *** |
| Y x V | *** | *** | *** | *** | *** | *** |
| F x V | ns | ns | ns | ns | *** | *** |
| Y x F x V | ns | ns | ns | ns | *** | *** |
Highly significant differences (p < 0.001) in the grain yield were observed between applications of fertilizer in both locations. The application of 100 g of poultry manure plus 3 g of NPK per hill (F8) resulted in the highest average yield of 2243 kg ha-1 and 2250 kg ha-1 in BUK and Minjibir, respectively. 31 showed that the micro-dosing of P fertilizers on pearl millet in soil with an acidic composition, in a sandy area, at a rate of 3-5 kg ha-1 produced almost the same yield as the broadcasting of P fertilizer at a rate of 15-20 kg ha-1, which is the typical rate in the Sahel 8. Greater success was observed in the present study's microdosing of NPK 3 g per hill, this produced a higher yield of grain in both locations than the recommended amount of fertilizer applied. The treatment F8 increased the mean yield of grain by 12%-86% in BUK and 29%-132 in Minjibir. The application of 100 g of poultry manure plus 3 g of NPK per hill was equivalent to the utilization of 80 kg N ha-1. This concords with the findings of 3, in a similar environment, who documented that sorghum had the greatest yield at the application of 80 kg N ha-1. The application of 100 g of poultry manure per hill produced significantly greater yields than the utilization of 100 g of cattle manure per hill, with 20 and 30 percent higher yields in BUK and Minjibir, respectively. This demonstrates the superiority of poultry manure over cattle manure as a form of organic fertilizer. Conversely, the combination of 100 g poultry manure with 3 g NPK per hill increased the yield significantly (13 and 55 percent for BUK and Minjibir, respectively) compared to sole poultry manure. This is of special significance to farmers who may not have the capacity to apply 150 g of poultry manure per hill (about 6000 kg ha-1). A mixture of poultry manure and inorganic fertilizer should be considered for the high productivity of sorghum. Among the varieties of sorghum, the Improved Deko had the highest average yield of 2548 kg ha-1 and 2096 kg ha-1 at BUK and Minjibir, respectively. The capacity of Improved Deko to produce higher than CSR 01 and local Kaura in both locations can be attributed to its earlier flowering behaviour, this behaviour occurred while the rain was stopped. However, the local Kaura's used in the experiment had been observed to adapt to the area and had a high degree of drought tolerance, this helped it to complete its growth cycle despite the lack of rainfall.
Additionally, the effect of the year was not significant in BUK, but Minjibir had a significant interaction with the year (Table 5). The highest average grain yield on all varieties was achieved in F8 (100 g of poultry manure plus 3 g of NPK per hill). The highest average grain yield for CSR 01 was documented as 1952 kg ha-1, which was obtained in 2017; 2950 kg ha-1 was the highest yield for Improved Deko in the same year, and 3238 kg ha-1 was the highest yield for local Kaura in 2018. Table 5 demonstrated that the fertilizers affected the stalk yield, the strategy of applying fertilizers increased the stalk yield compared to the zero-fertilizer strategy in both locations. The highest average yield of stalks was achieved with the application of 100 g of poultry manure plus 3 g of NPK per hill, this produced 11,688 kg ha-1 and 10,239 kg ha-1, which were 39% and 48 % greater than the control that produced the least value in both locations. Among the varieties of sorghum, CSR 01 had the highest yield of stalks with a mean value of 9970 kg ha-1, while the lowest value was observed to be 8219 kg ha-1 and was derived from Improved Deko at BUK, while in Minjibir, Improved Deko produced the highest yield of stalks with a mean value of 11,965 kg ha-1, and the lowest value was 7857 kg ha-1 from local Kaura.
Table 5. Interactions between Year, Fertilizer, and Variety on Grain and Stalk Yields in Minjibir| Year | Fertilizer | Grain Yield (kgha -1 ) | Stalk Yield (kgha -1 ) | ||||
| Variety | |||||||
| CSR-01 | Improved Deko | Kaura | CSR-01 | Improved Deko | Kaura | ||
| 2016 | F1 | 784 | 1254 | 649 | 3386 | 10637 | 2560 |
| F2 | 937 | 1990 | 591 | 4025 | 16085 | 3474 | |
| F3 | 911 | 1776 | 575 | 3658 | 13496 | 2707 | |
| F4 | 1225 | 2666 | 784 | 9024 | 23308 | 6144 | |
| F5 | 1201 | 2929 | 721 | 10807 | 22744 | 4857 | |
| F6 | 1461 | 1992 | 951 | 9291 | 14918 | 6318 | |
| F7 | 1244 | 2265 | 623 | 6421 | 15290 | 5457 | |
| F8 | 1347 | 3648 | 782 | 7185 | 24276 | 7306 | |
| F9 | 1340 | 1984 | 600 | 7351 | 18034 | 5875 | |
| F10 | 1117 | 2481 | 901 | 4513 | 15360 | 3073 | |
| Mean | 1198 | 2415 | 725 | 6566 | 17415 | 4777 | |
| 2017 | F1 | 628 | 1332 | 995 | 7023 | 7527 | 7943 |
| F2 | 907 | 1896 | 1581 | 10086 | 10686 | 9803 | |
| F3 | 1077 | 1513 | 1091 | 10510 | 7997 | 8910 | |
| F4 | 961 | 1562 | 1637 | 10286 | 9286 | 13303 | |
| F5 | 1174 | 2138 | 1310 | 10953 | 9340 | 10090 | |
| F6 | 1425 | 2022 | 1865 | 9506 | 8870 | 10666 | |
| F7 | 1201 | 1902 | 1100 | 10670 | 9163 | 11000 | |
| F8 | 1952 | 2950 | 2302 | 12203 | 11710 | 12510 | |
| F9 | 1177 | 2610 | 1587 | 13033 | 10426 | 11286 | |
| F10 | 960 | 1246 | 1297 | 9076 | 8530 | 11200 | |
| Mean | 1204 | 1982 | 1530 | 10335 | 9354 | 10671 | |
| 2018 | F1 | 693 | 1195 | 1195 | 5067 | 5967 | 4433 |
| F2 | 867 | 2042 | 1904 | 7067 | 8233 | 6967 | |
| F3 | 577 | 1343 | 1205 | 6167 | 7033 | 6467 | |
| F4 | 945 | 2327 | 2057 | 9300 | 10100 | 9866 | |
| F5 | 860 | 2669 | 2438 | 9100 | 10000 | 9633 | |
| F6 | 1025 | 2333 | 1875 | 9833 | 11000 | 9200 | |
| F7 | 757 | 2060 | 1955 | 7600 | 9866 | 8766 | |
| F8 | 1437 | 2875 | 3238 | 9300 | 10733 | 9966 | |
| F9 | 944 | 2087 | 2125 | 8433 | 9966 | 8700 | |
| F10 | 778 | 1783 | 1203 | 8233 | 8367 | 7233 | |
| Mean | 910 | 2169 | 2000 | 8090 | 9127 | 8123 | |
| LSD | 556 | 2400 | |||||
Table 6 depicts the contrast analysis that compares the mean grain yields of selected block fertilizer strategies. The application of sole poultry manure increased the average yield of grain by over 100%, from 1593 kg ha-1 to 2428 kg ha-1. Similarly, significant differences between sole poultry manure (1911 kg ha-1) and the combination of poultry manure 100 g plus 3 g NPK per hill (2302 kg ha-1) were observed, which indicated a 17% increase in yield for a 3 g NPK per hill applied to sole poultry. In both locations, significant differences were observed between the means of sole poultry manure applications and controls (no fertilizer). In BUK, significant differences were observed between the application of sole poultry manure (average of 1911 kg ha-1) and zero fertilizer (1208 kg ha-1) which indicated a 37% increase in yield.
Table 6. Contrast Analysis of Sole Poultry Manure against other Fertilizer Combinations for Grain Yields of Sorghum from the Experimental sites (2016 to 2018).| Fertilizer Contrasts | Description | BUK | Minjibir | |||||||
|---|---|---|---|---|---|---|---|---|---|---|
| mean | F-probability | mean | F-probability | |||||||
| F7, F9 -10 Vs F1 | Poultry Manure versus Control | 1911 | <.001 | 1593 | <.001 | |||||
| vs | vs | |||||||||
| 1208 | 958 | |||||||||
| F7, F9 -10 Vs F2 | Poultry Manure versus Poultry Manure + Cattle Manure | 1911 | 0.737 | 1593 | 0.327 | |||||
| vs | vs | |||||||||
| 2042 | 1480 | |||||||||
| F7, F9 -10 Vs F3 | Poultry Manure versus Cattle Manure | 1911 | 0.567 | 1593 | 0.027 | |||||
| vs | vs | |||||||||
| 1732 | 1337 | |||||||||
| F7, F9 -10 Vs F4 | Poultry Manure versus NPK 80:60:60 | 1911 | 0.215 | 1593 | 0.782 | |||||
| vs | vs | |||||||||
| 1829 | 1625 | |||||||||
| F7, F9 -10 Vs F5 | Poultry Manure versus NPK Micro-dose | 1911 | 0.213 | 1593 | 0.067 | |||||
| vs | vs | |||||||||
| 1960 | 1806 | |||||||||
| F7, F9 -10 Vs F6 | Poultry Manure versus Cattle Manure + NPK Micro-dose | 1911 | 0.366 | 1593 | 0.367 | |||||
| vs | vs | |||||||||
| 2091 | 1698 | |||||||||
| F7, F9 -10 Vs F8 | Poultry Manure versus Poultry Manure + NPK Micro-dose | 1911 | 0.007 | 1593 | <.001 | |||||
| vs | vs | |||||||||
| 2302 | 2398 | |||||||||
| Standard error (SE) | 124.8 | 100 | ||||||||
The effects of nitrogen and water-use efficiency on the sorghum yield
Nitrogen use efficiency (NUE)
The application of fertilizer and the variety used had significant impacts on the nitrogen use efficiency (NUE) of sorghum in both locations (Table 7). The results revealed that NUE reduces with an increase in the quantity of N applied and responds positively to crop moisture availability. The NUE in BUK ranged from 37.6 to 7.8 kg grain kg N-1 obtained from the application of 20 kg and 95 kg N ha-1 as NPK at 3 g per hill and poultry manure at 150 g per hill, respectively. In Minjibir, similar conclusions were reached though with different average values. 40 and 8.3 kg grain kg N-1 were found to have the highest and lowest mean NUE values, respectively, from the application of 20 kg and 95 kg N ha-1 as NPK at 3 g per hill and poultry manure at 150 g per hill. This agrees with the findings of 12and 3, who also reported a decrease in NUE with an increase in the rate of N applied on sorghum though the effect of initial soil fertility was significant. On the varieties that were tested, there were differences among them regarding NUE. In both locations, Improved Deko had a higher NUE than the local Kaura, with CSR 01 having the lowest average NUE values of all locations. In BUK, 22.7 and 9.8 kilograms of grain were each found to have the highest mean, in contrast, the least significant mean values were derived from Improved Deko and CSR 01, respectively. In Minjibir, the highest and least mean NUE values were obtained from Improved Deko and CSR 01, respectively. This is caused by the chemical and physical differences between the varieties, as well as the variety's response to the environment which is dependent on the day of maturity 2. This implies that varieties with earlier days to maturity have a higher NUE than varieties with late days to maturity. This concords with the findings of 18, 29; 30.
Table 7. Effects of Nitrogen and Water-use Efficiencies on Grain Yields of Sorghum from the Experimental Sites| Treatments | BUK | Minjibir | ||
|---|---|---|---|---|
| NUE (kg grain kgN -1 ) | WUE (kg grain mm -1 ) | NUE (kg grain kgN -1 ) | WUE (kg grain mm -1 ) | |
| Fertilizer (F) | ||||
| F1 | 5.2 | 4.0 | ||
| F2 | 18.0 | 5.4 | 14.1 | 3.5 |
| F3 | 16.8 | 4.4 | 14 | 3.1 |
| F4 | 8.7 | 4.9 | 9.4 | 3.9 |
| F5 | 37.6 | 5.2 | 40 | 4.3 |
| F6 | 17.5 | 5.6 | 18.3 | 4 |
| F7 | 12.7 | 5.2 | 11.5 | 3.7 |
| F8 | 13.7 | 6.1 | 19.6 | 5.6 |
| F9 | 7.8 | 5.3 | 8.3 | 4.2 |
| F10 | 16.7 | 4.5 | 19.2 | 3.4 |
| P of F | <.001 | <.001 | <.001 | <.001 |
| LSD | 4.6 | 0.6 | 1.1 | 0.4 |
| Variety (V) | ||||
| CSR-01 | 9.8 | 3 | 12.5 | 2.5 |
| Improved Deko | 22.7 | 7.7 | 26.1 | 5.8 |
| Kaura | 17.3 | 4.8 | 12.8 | 3.6 |
| P of F | <.001 | <.001 | <.001 | <.001 |
| LSD | 2.64 | 0.3 | 0.6 | 0.188 |
| Mean | 16.6 | 5.2 | 17.2 | 4 |
| CV | 14.7 | 21.4 | 13 | 18.6 |
| Interactions | ||||
| F x V | *** | *** | *** | *** |
Water use efficiency (WUE)
Table 7 showed that fertilizer application methods and sorghum varieties had a significant impact on the water use efficiency (WUE) of both locations. Highly significant discrepancies existed in the microdosing strategies for WUE in both locations. In both BUK and Minjibir, the application of 100 g poultry manure plus 3 g NPK per hill had the highest average WUE, in contrast, the application of 100 g cattle manure had the lowest average WUE. In BUK, the mean value of 6.11 kg grain mm-1 rain received was observed to be the highest whereas 4.4 kg grain mm-1 was the least. In Minjibir, 5.63 kg grain mm-1 was observed to be the highest, while the least was 3.09 kg grain mm-1. Highly significant differences existed amongst the sorghum varieties for WUE in both locations. The results in Table 7 indicated that in both experimental locations, Improved Deko had higher WUE than local Kaura, with CSR 01 reporting the least mean values. In BUK, 7.66 kg and 3.02 kg grain mm-1 were found to be the highest and the lowest mean WUE values obtained under Improved Deko and CSR 01, respectively. As for the Minjibir experimental site, 5.83 kg and 2.5 kg grain mm-1 were the highest and the lowest mean WUE values obtained for Improved Deko and CSR 01, respectively. The results suggested that varieties that were more mature earlier in the season had a higher WUE than varieties that were more mature later in the season, particularly if they had a similar or higher yield of grain. This concords with the findings of 18. (2015). Figure 1 shows that Improved Deko had the least amount of moisture lost through ETo in both locations, while CSR 01 had the greatest amount of moisture lost through ETo in both locations. These results showed that the longer the days to maturity of a sorghum variety, the higher its probability of experiencing crop moisture loss via ETo, and the lower its overall WUE. However, it may also be based on drought tolerance, as varieties that have a lower need for moisture are more likely to be drought tolerant. Improved Deko is reportedly more drought-resistant than CSR 01 2.
Figure 1.Estimated seasonal grain yield water use efficiency (GY_WUE) for each tested sorghum variety in BUK and Minjibir sites.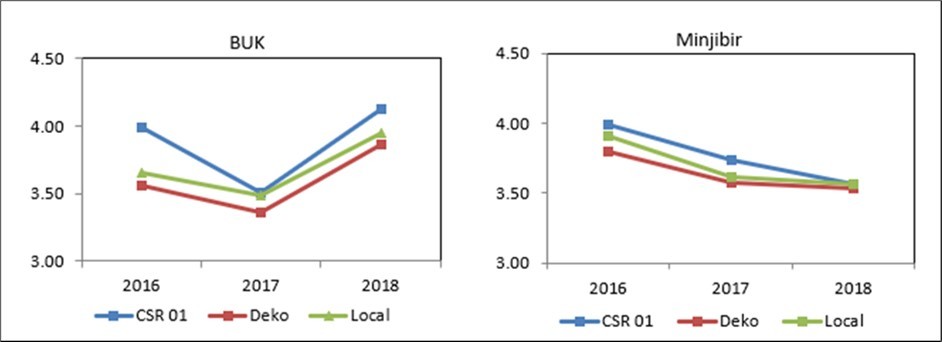
Economic analysis of different fertilizer application strategies for the sorghum varieties
Table 8 revealed significant differences among the fertilizer application strategies, and sorghum varieties forTotal Cost of Production (TCP), Total Revenue Generated (TR), Net Profit (NP), and Benefit: Cost Ratio (B: C), in both locations. The application of NPK at 3 g per hill (F5) produced the highest mean net profit (N246,888 and N276,522) and benefit-cost (3.21 and 3.58) ratio while the poultry manure (F9) estimated the least net profit (N 104,779 and N 114,786) and benefit-cost (1.4 and 1.5) ratio, both at BUK and Minjibir, respectively. The results further revealed that the application of poultry manure (100 g per hill) plus 3 g per hill of NPK (F8) had the highest mean total revenue (TR) generated while the lowest TR was obtained from control (zero fertilizer treatment). It was observed that F8 (poultry manure (100 g per hill) plus 3 g per hill of NPK) produced the highest mean grain and stalk yields and estimated the highest mean TR in both experimental sites but did not proportionate to higher NP and B: C ratio. These results were attributed to the high cost of production, precisely the high cost of fertilizers and poultry manure in the area, and agreed with the findings by 25 who also reported less profit gained on sorghum when produced at a higher cost.
Table 8. Total Cost of Production, Total Revenue Generated and Net Profit of Sorghum as influenced by Years of Production, Fertilizer Micro-dose Application Strategies and Varieties at experimental sites (2016-2018)| Treatments | BUK | Minjibir | ||||||
|---|---|---|---|---|---|---|---|---|
| TCP | TR | NP | B: C ratio | TCP | TR | NP | B: C ratio | |
| Naira ha-1 | Naira ha-1 | |||||||
| Fertilizer (F) | ||||||||
| F1 | 85,064 | 242,348 | 157,284 | 2.85 | 80,765 | 211,760 | 130,995 | 2.62 |
| F2 | 178,435 | 398,626 | 220,191 | 2.23 | 168,426 | 309,018 | 140,592 | 1.83 |
| F3 | 138,412 | 338,659 | 200,247 | 2.44 | 134,380 | 275,613 | 141,233 | 2.05 |
| F4 | 145,339 | 349,945 | 204,606 | 2.41 | 141,122 | 375,833 | 234,711 | 2.68 |
| F5 | 111,275 | 358,163 | 246,888 | 3.21 | 108,168 | 384,690 | 276,522 | 3.58 |
| F6 | 158,151 | 380,146 | 221,995 | 2.4 | 155,310 | 360,166 | 204,856 | 2.32 |
| F7 | 215,166 | 381,782 | 166,616 | 1.77 | 199,628 | 335,708 | 136,080 | 1.68 |
| F8 | 238,252 | 425,129 | 186,877 | 1.78 | 224,526 | 460,267 | 235,741 | 2.05 |
| F9 | 275,031 | 379,810 | 104,779 | 1.38 | 255,358 | 370,144 | 114,786 | 1.45 |
| F10 | 153,047 | 325,774 | 172,727 | 2.12 | 145,112 | 307,002 | 161,890 | 2.12 |
| Variety (V) | ||||||||
| CSR-01 | 169,817 | 324,635 | 154,818 | 2.06 | 161,280 | 276,200 | 114,920 | 1.82 |
| Improved Deko | 411,395 | 241,578 | 2.59 | 441,567 | 280,287 | 2.95 | ||
| Kaura | 338,085 | 168,268 | 2.12 | 299,293 | 138,013 | 1.95 | ||
| Mean | 169,817 | 358,038 | 188,221 | 2.26 | 161,280 | 339,020 | 177,740 | 2.24 |
Among the varieties, Improved Deko had the highest mean net profit and benefit-cost ratio while CSR 01 had the lowest. In BUK, Improved Deko had a mean NP of N241,578 and B: C of 2.6 while CSR 01 had a mean NP of N154,818, and B: C of 2.0. Similarly, at Minjibir, Improved Deko had a mean NP of N280,287 and B: C of 3.0 while the lowest mean values were produced by CSR 01 with an NP of N114,920, and B: C of 2.1. This suggests a higher return on investment by cultivating Improved Deko than other varieties (CSR 01 and local Kaura). This was attributed to the high mean grain yield produced by Improved Deko. This agrees with the findings of 19 who reported higher benefit-cost ratios on sorghum varieties with high grain yields.
Conclusion and Recommendation
Current research shows that fertilization can directly affect fertility pollination and the number of seeds per panicle rather than the weight of individual seeds, but it has a very significant impact on grain yields. However, there are significant differences in seed weight between different sorghum varieties. Weather, especially rainfall distribution, affects grain and Stalk yields. The sorghum variety (improved Deko syn: SAMSORG 45) is more suitable for the Sudan savanna region of Nigeria and is worthy of promotion. The improved Deko resulted in average grain yields 56% and 49% higher than CSR 01 and local Kaura in BUK and Minjibir, respectively. Tests have shown that applying a small amount of organic and inorganic fertilizers can significantly increase sorghum grain and stalk yields compared with blanket-type recommended inorganic fertilizers. For example, 100 g of poultry manure plus 3 g of NPK per hill increased yields by 7-86% in BUK and 29-132% in Minjibir compared to other fertilization strategies and no fertilization. Likewise, poultry manure has a higher nutrient content than cow manure, resulting in higher grain and stalk yields per unit of manure.
NUE is driven by changes in N remobilization and utilization, and it increases with a decrease in the quantity of N applied, which has a positive impact on soil water availability. Excessive rainfall increases nitrogen losses through leaching and favors soil conditions associated with denitrification activities and processes. Applying 20 kgNha-1, i.e. 3 g NPK per hill instead of 95 kgNha-1, i.e. 150 g poultry manure, indicated NUE of 37.6 and 7.8 kg grain kgN-1 at BUK, and 40 and 8.3 kg grain kgN-1 at Minjibir, respectively. The WUE of the improved Deko was 7.66 kg and 5.83 kg of grain mm-1, while the CSR 01 had the lowest WUE values of 3.02 kg and 2.5 kg of grain mm-1 at BUK and Minjibir,. Application of NPK at 3 g per hill recorded higher benefit-cost ratios of 3.21 and 3.58 benefitted per naira invested and better profit gains of N 246,888 and N 276,522 ha-1 for BUK and Minjibir, respectively. In organic farming without the use of inorganic fertilizers, higher grain and Stalk yields can be obtained by applying 150 grams of poultry manure per hill and deserve further consideration as a preferred application. Under integrated farming systems, where farmers produce organic fertilizer on-site, 100 grams of poultry manure plus 3 grams of NPK per hill is applied, resulting in high sorghum grain yield and good benefits. Improved Deko is found to be the variety with the best grain yield, NUE, WUE, total revenue generation, total profit gain, benefit-cost ratio, and the least crop moisture loss through crop evapotranspiration, therefore considered the best sorghum variety to be produced in the experimental locations. Further analysis and modeling of nutrient cycling and organic farming, especially poultry production and the use of poultry manure to grow sorghum is recommended.
Acknowledgment
The authors thank the International Crops Research Institute for the Semi-Arid Tropics (ICRISAT) for institutional support of this study. The experiments are part of the ICRISAT Global Research Program “Resilient Farms and Food Systems”, under Climate Adaptation and Mitigation, Landscape, Soil Fertility, and Water Management clusters. The World Bank-funded AICCRA (Accelerating CGIAR Impacts of Climate Research in Africa) project (Project ID 173398) and the CGIAR Climate Resilience Initiative (also known as the ClimBeR project) through a collaboration between ICARDA and ICRISAT are eligible to fund the time spent by Folorunso M. Akinseye. Akinseye was responsible for analyzing and writing the manuscript of this study. We would also like to thank the anonymous reviewers whose comments and suggestions improved the manuscript.
References
- 1.Abrha K. Thesis), Haramaya University (2013) Growth, Productivity, and Nitrogen Use Efficiency of Maize (ZeamaysL.) as Influenced by Rate and Time of Nitrogen Fertilizer Application in Haramaya District. , Eastern Ethiopia, (M.Sc
- 2.H A Ajeigbe, A Y Kamara, M B Vabi, Muricho G, Olupona O et al. (2021) . Adoption and Welfare Impacts of Improved Sorghum Technologies in Northern Nigeria. Technical Working Document. Patancheru 502 324, Telangana, India: International Crops Research Institute for the Semi-Arid Tropics. ISBN 978-81.
- 3.H A Ajeigbe, F M Akinseye, Kunihya A, Jerome J. (2018) Productivity and Water Use Efficiency of Sorghum [Sorghumbicolor(L.) Moench] Grown under Different Nitrogen Applications in Sudan Savanna Zone. , Nigeria,International Journal of Agronomy 11-10.
- 4.F M Akinseye, Adam M, S O Agele, M P Hofmann, Traore P C S et al. (2017) Assessing crop model improvements through comparison of sorghum (SorghumbicolorL. Moench) simulation models: a case study of West African varieties.Field Crops Research,201.
- 5.R G Allen, L S Pereira, Raes D, Smith M. (1998) Crop evapotranspiration—guidelines for computing crop water requirements, FAO Irrigation and Drainage Paper 56, Food and Agriculture Organization. , Rome, Italy
- 7.Barron J, Rockstrom J, Gichuki F, Hatibu N. (2003) Dry Spell Analysis and Maize Yields for Two Semiarid Locations in East Africa.Agricultural and Forest Meteorology. 117, 23-37.
- 8.Bationo A, A U Mokwunye. (1991) Alleviating soil fertility constraints to increased crop production in West Africa: the experience in the Sahel. In Alleviating Soil Fertility Constraints to Increased Crop Production. Developments in Plant and Soils Sciences in West Africa (ed., A. U. Mokwunye) , Dordrecht, the Netherlands: 47, 195-215.
- 9.Behari P, C R Hazara. (1989) . Forage Productivity of Sorghum and Oat-Evapotranspirational Studied.Forage Research 15(2), 162-166.
- 10.Bollam S, Romana K K, Rayaprolu L, Vemula A, Das R R et al. (2021) Nitrogen Use Efficiency in Sorghum: Exploring Native Variability for Traits Under Variable N-Regimes. , Front. Plant Sci 12, 643192-10.
- 11.Buah S S J, Mwinkaara S. (2009) . Response of Sorghum to Nitrogen Fertilizer and Plant Density in the Guinea Savanna Zone. Journal of Agronomy,8: 124-130.
- 12.Buah S S J, J M Kombiok, L N Abatania. (2012) . Grain sorghum response to NPK fertilizer in the Guinea Savanna of Ghana.Journal of Crop Improvement 26(1), 101-115.
- 13.Degu T, Elias G, Gtachew H. (2021) Effects of Nitrogen Fertilizer Quantity and Time of Application on Sorghum (Sorghumbicolor(L.) Moench) Productivity in Lowland Areas of North Shewa. , Ethiopia.International Journal of Agronomy 2021, p..
- 14.Doorenbos J, A H Kassam. (1979) Yield response to water,” FAO Irrigation and Drainage Paper 33, Food and Agriculture Organization of the United Nations. , Rome, Italy
- 15.Ekeleme F, J M, Kamara A Y Olioch, O M, Abdullaji T et al. Biophysical Baseline Survey, International Institute of Tropical Agriculture (2013) Level and extent of Striga infestation of maize and cattle pea crops in Bauchi and Kano States. , Nigeria
- 16.D F Emater. (2009) Technical Assistance and Rural Extension of Distrito Federal. http://www.emater.df.gov.br/index.php?option=com_content&view=article&id=75 &Itemid=87
- 18.J C Gardner, J W Maranville, E T Paparozzi. (1994) Nitrogen use efficiency among diverse sorghum cultivars.Crop. , Science 34(3), 728-733.
- 19.Gebru B, Fantaye B, Tsegay G, Daniel D. (2019) Enhancing sorghum yield through demonstration of improved sorghum varieties in Tanqua-Abergelle Wereda. , Central Zone of Tigray, Ethiopia.Journal of Agricultural Extension and Rural Development 11(1), 11-16.
- 20.Gentili R, Ambrosini R, Montagnani C, Caronni S, Citterio S. (2018) Effect of soil pH on the growth, reproductive investment and pollen allergenicity of Ambrosiaartemisiifolia. 9, 1335-10.
- 21.Goenster S, Wiehle M, Gebauer J, A, R D Stern et al. (2015) Daily Rainfall Data to Identify Trends. in Rainfall Amount and Rainfall Induced Agricultural Events in the Nuba Mountains of Sudan.Journal of Arid Environments 22, 16-26.
- 23.A G Good, A K Shrawat, D G Muench. (2004) Can less yield more? Is reducing nutrient input into the environment compatible with maintaining crop production. , Trends Plant Sci 9, 597-605.
- 24.Hensley M, J, Staden P P Van, Toit Du, A. Water Research Commission (2000) Optimizing rainfall use efficiency for developing farmers with limited access to irrigation water. WRC Report No. 878/1/00 , Pretoria, South Africa
- 25.Huihui L, Lantain R, Huub S, Yongbin Z, H X Guang. (2015) An Economic Analysis of Sweet Sorghum Cultivation for Ethanol Production in North China.GCBBioenerg. 7, 1176-1184.
- 26.Jewitt G W P, H W Wen, R P Kunz, Rooyen A M Van. Water Research Commission (2009) Scoping study on water use of crops/trees for biofuels in South Africa. , Pretoria, South Africa, WRC Report 1772.
- 27.Katy B, B A Daryl, Apurba S, Chad G, Hailin Z et al. (2012) Determining Critical Soil pH for Grain Sorghum Production.International. , Journal of Agronomy 2012, p..
- 28.Kuslu Y, Sahin U, Tunc T, F M Kiziloglu. (2010) Determining water-yield relationship, water use efficiency, seasonal crop and pan coefficients for alfalfa in a semiarid region with high altitude.Bulgarian. , Journal of Agricultural Science 16(4), 482-492.
- 29.Masclaux-Daubresse C, Chardon F. (2011) Exploring nitrogen remobilization for seed filling using natural variation in Arabidopsis thaliana. , J. Exp. Bot 62, 2131-2142.
- 30.J S Mishra, N S Takur, Singh P, K, Alse R et al. (2015) Productivity, nutrient use efficiency and economics of rainy-season grain sorghum (Sorghumbicolor) as influenced by fertility levels and cultivars.Indian. , Journal of Agronomy 60(1), 76-81.
- 31.Muehlig-Versen B, Buerkert A, Bationo A, Roeheld V. (2003) Phosphorus placement on acid arenosols of the west African Sahel. , Experimental Agriculture 39, 307-325.
- 32.R H Moll, E J Kamprath, W A Jackson. (1982) Analysis and Interpretation of Factors Which Contribute to Efficiency of Nitrogen Utilization. , Agron 74, 562-564.
- 33.S O Ojeniyi. (2000) Effects of goat manure on soil nutrient content and okra yield in the rainforest area. , Nigeria.Applied Journal of Tropical Agriculture 51.
- 34.R K Pandey, J W Maranville, Bako Y. (2001) Nitrogen fertilizer response and use efficiency for three cereal crops. in Niger.Communications in Soil Science and Plant Analysis 32, 9-10.
- 35.Prasad R.2009.Enhancing nutrient use efficiency: environmental benign strategies, The Indian Society of Soil Science. , New Delhi, India 67-74.
- 36.T R Sinclair, C B Tannar, J M Bennett. (1984) . Water-use Efficiency in Crop Production.Bioscience 34(1), 36-40.
- 37. (2007) Improving cereal productivity and farmers’ income using a strategic application of fertilizers in West Africa. In Advances in Integrated Soil Fertility Management in Sub-Saharan Africa: Challenges and Opportunities Tabo, R., Bationo, A., Gerard, B., Ndjeunga, J., Marchal, D., Amadou, B., Annou, M. G., Sogodogo, D., Taonda, J.-B. S., Hassane, O., Diallo, M. K. and Koala, S , Dordrecht, The Netherlands: 201-208.
- 38.Tabo R, Bationo A, Hassane O, Amadou B, Fosu M et al. (2008) Fertilizer micro-dosing for the prosperity of resource-poor farmers: a success story. Proceedings of the Workshop on Increasing the Productivity and Sustainability of Rainfed Cropping Systems of Poor, Smallholder Farmers , Tamale, Ghana, 22‐25 .
Cited by (2)
This article has been cited by 2 scholarly works according to:
Citing Articles: